Task 2.3 - Create and Track Custom Statistics
Task Overview
As you know from the previous tutorial tasks, the staytime statistic tracks the time a flow item enters an object from the time it exits the object. But what if you wanted to track the staytime of a flow item across multiple objects? For example, perhaps you'd like to like to track the staytime of flow items from the moment it enters and exits a workstation consisting of potentially multiple objects. Statistics collectors have the ability to create these kinds of custom staytime statistics. This tutorial task will demonstrate some of these capabilities.
In this tutorial task, you'll learn how to create custom statistics using a statistics collector. You'll also learn how you can transform data from a statistics collector using a calculated table. This tutorial task will also cover how to create a data table to display the current content statistics from a group of objects.
Step 1 Create a Custom Staytime Statistic
In this step, you'll create a new statistics collector that will listen to the staytime of flow items in the entire workstation. You'll create this custom staytime by listening to flow items when they first enter a queue and when they exit a processor. You'll also create a label called Item to track the ID of the flow item that triggers both of these events.
To listen to these events in the simulation model:
- In the Toolbox, click the Add button
 to open a menu. Point to
Statistics, then select Statistics
Collector to create a new collector and open its properties window.
to open a menu. Point to
Statistics, then select Statistics
Collector to create a new collector and open its properties window. - In the name box at the top of the properties window, change the name of the collector to WorkstationStaytimes.
- In the Event Listening tab, click the
Sampler button
 to enter sampling mode.
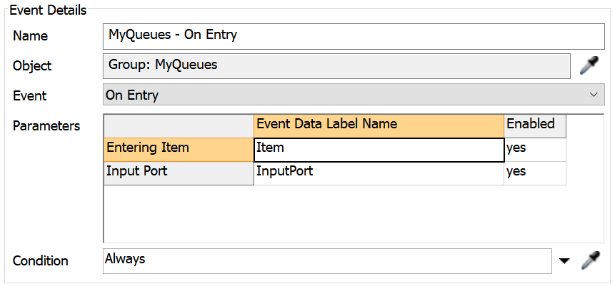
 - In the Toolbox, click the MyQueues group to open a menu. Select On Entry to sample it. Confirm that this event now shows up in the statistic collector's event list.
- With this new event selected in the event list, look in the Event Details for the Parameters table. Double-click the cell on the Entering Item row under the Event Data Label Name column. Delete the current text and give this label the name Item.
- Click the Sampler button
above the event list to enter
sampling mode again.
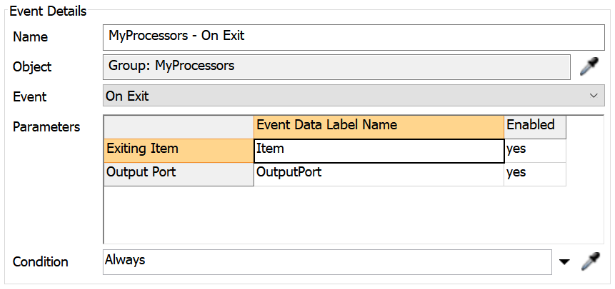
- In the Toolbox, click the MyProcessors group to open a menu. Select On Exit to sample it. This event should also show up in the statistic collector's event list.
- With this new event selected in the event list, look in the Event Details for the Parameters table. Double-click the cell on the Exiting Item row under the Event Data Label Name column. Delete the current text and give this label the name Item to match the label name in the queue's on entry event.
Consider saving your simulation model.
Step 2 Set Up an Event-Dependent Data Table
In the previous step, you set up a statistics collector so that it could listen to flow items when they enter a queue and exit a processor. In this step, you'll set up the data table that will track each flow item and update columns depending on whether they are entering or exiting the workstation.
To create this data table:
- In the Data Recording tab in the Rows group, open the Row Creation Mode menu. Select Unique Row Values.
- Click the Row Value menu, select Item. (This is the same event data label you created previously.)
- In the Columns group, click the
Add button
to add a new column.
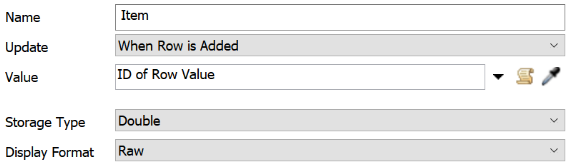
- In the Name box, change the name of the column to Item.
- Click the Update menu and select When Row is Added.
- Click the arrow next to the Value box to open a menu. Point to IDs, then select ID of Row Value.
- Click the Display Format menu and select Raw.
- In the Columns group, click the
Add button
to add a new column.
- In the Name box, change the name of the column to EnterTime.
- Click the arrow next to the Value box to open a menu. Point to Time, then select Model Date/Time.
- Repeat the previous steps to add a third column, but change its name to ExitTime.
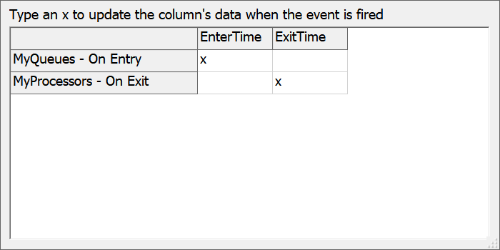
- Under the column list, click the Edit Event/Column Dependencies button to open a table showing all the events the statistics collector is listening to and the two new columns you created.
- Click the cell on the MyQueues - On Entry row under the Enter Time column. Type an X in this cell. Also type an X in the MyProcessors - On Exit row under the Exit Time column.
- In the General tab, click the View Table button to open the data table for this collector.
- Reset and run the model.
As you run the model, notice in the data table that the entry time column updates when a flow item enters a queue. Then the exit time column updates when the same flow item exits a processor:
Step 3 Create a Calculated Table
In this step, you'll create a calculated table to get additional custom statistics. The Calculated Table tool can transform the raw data from a collector's data table. In this step, you'll create a table that can calculate the total staytime of a flow item in a workstation (from the moment it enters the queue and the moment it exits the processor).
Calculated tables use SQL queries to create these custom statistics. In this step, you'll build an SQL query that will subtract a flow item's entry time from its exit time. It will get this data from the WorkstationStaytimes statistics collector. You'll display this in a new column named TotalTime.
Be aware that you can export the information from any data table, including the data tables generated by a calculated table. You can then use any third-party software to analyze this data if you prefer.
To set up this calculated table:
- In the Toolbox, click the Add button
to open a menu. Point to
Statistics, then select Calculated
Table to create a new table and open its properties window.
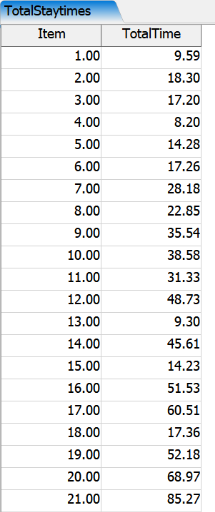
- In the name box at the top of the properties window, change the name of this calculated table to TotalStayTimes.
- In the Query box, type
SELECT Item, ExitTime -
			EnterTime AS TotalTime FROM WorkstationStaytimes
. - Click the Update button, then click the
See Results button
 to see the complete calculated
table.
to see the complete calculated
table.
Consider saving your simulation model.
Step 4 Create a Current Statistics Data Table
In this step, you'll learn how to create a data table in the statistics collector that can record the current statistics for a group of objects. To create this kind of statistics collector, you'll use the Enumerated Rows row creation mode in your data table. This type of statistics collector records the current statistics for all the objects that you specify in the Enumerated Rows list. This data table will continually refresh and update while the simulation model runs. Since these kinds of statistic collectors listen to any specific events, you'll skip the event listening tab.
In this step, you'll gather statistics on the input, output, and average content of all the queues in the simulation model. Since you've already created a group for all your queues in a previous tutorial task, you'll only need to add the MyQueues group to the enumerated rows list. The statistics collector will create a row for each group member in the data table.
To create this statistics collector:
- In the Toolbox, click the Add button
. to open a menu. Point to
Statistics, then select Statistics
Collector to create a new collector and open its properties window.
- In the name box at the top of the properties window, change the name of the collector to QueueStatistics.
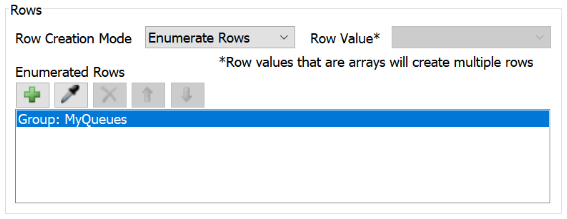
- In the Data Recording tab, click the Row Creation Mode menu and select Enumerate Rows.
- Next the Enumerated Rows list, click the
Sampler button
to enter sampling mode.
- In the Toolbox, click the MyQueues group to sample it. The group should now appear in the Enumerated Rows list.
- In the Columns group, click the
Add button
to add a new column.
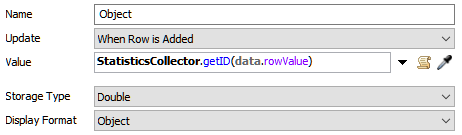
- In the Name box, change the name of the column to Object.
- Click the Update menu and select When Row is Added.
- Click the arrow next to the Value box to open a menu. Point to IDs, then ID of Row Value.
- In the Columns group, click the
Add button
to add a new column.
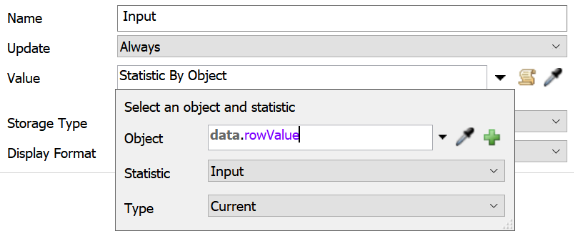
- In the Name box, change the name of the column to Input.
- Click the Update menu and select Always.
- Click the arrow next to the Value box to open a menu. Point to Object Statistics, then Statistic by Object to open a picklist options window.
- In the picklist options in the Object box, type
data.rowValue. - Click the Statistic menu and select Input.
- In the Columns group, click the
Add button
to add a new column.
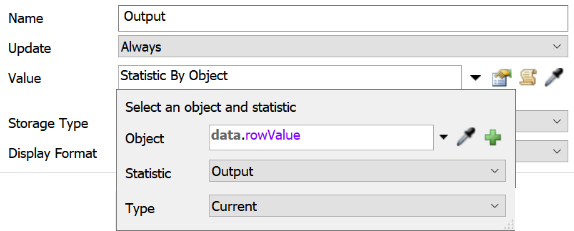
- In the Name box, change the name of the column to Output.
- Click the Update menu and select Always.
- Click the arrow next to the Value box to open a menu. Point to Object Statistics, then Statistic by Object to open a picklist options window.
- In the picklist options in the Object box, type
data.rowValue. - Click the Statistic menu and select Output.
- Click the OK button to save the changes and close the window.
- In the General tab, click the View Table button to open the data table for this collector.
- Reset and run the model.
As your model runs, notice that your data table will refresh to give the most current statistics about each queue's current input and output:
You could create this kind of data table with any of the other object statistics that are available, such as the minimum content, the maximum, and the average.
Step 5 Add Charts to Compare Current Statistics
In this step, you'll create three different charts to display the current statistics of the queues. You'll create a bar chart comparing the input and ouput of the cues. You'll also create a pie chart and a table chart that displays this same data.
To create these charts:
- Double-click in a blank space in the dashboard to open the Quick Library.
- Under the Charts group, click the Bar Chart to add it to the dashboard. Its properties window will open automatically.
- In the name box at the top of the window, change the display name of the chart to Queue Input vs. Output.
- On the Data tab, click the Data Source menu and select the QueueStatistics collector.
- Click the Title menu and select Object.
- In the Include group, check the Input and Output checkboxes.
- On the Settings tab, clear the Show Percentages checkbox.
- Click OK button to save the changes and close the window.
- Double-click in a blank space in the dashboard to open the Quick Library.
- Under the Charts group, click the Pie Chart to add it to the dashboard. Its properties window will open automatically.
- Repeat the previous steps for the pie chart.
- You might need to resize the pie chart to show all the pie charts. You can click it and use the black sizer boxes to resize it as needed.
- Double-click in a blank space in the dashboard to open the Quick Library.
- Under the Charts group, click the Table Chart to add it to the dashboard. Its properties window will open automatically.
- In the name box at the top of the window, change the display name of the chart to Queue Input vs. Output.
- In the Data tab in the Include group, check all three checkboxes: Object, Input, and Output.
- Click OK button to save the changes and close the window.
- Reset and run the model.
Notice that after a certain amount of time has passed, the trends in the queue content tend to stabilize:
Conclusion
This concludes the Statistics Collector tutorial. Hopefully you now have a good sense of the potential for getting exactly the data you want from your simulation model. Keep in mind that you can also export the raw data from each data table for further analysis in third party software.