Using the Distribution Chooser
About the Distribution Chooser
One feature that sets FlexSim apart from other simulation tools is the ability to quickly and easily build a little bit of variability and randomness into your simulation model. FlexSim gives you the ability to simulate many kinds of fluctuations in your business system. Fortunately, you don't need to know a lot of complicated mathematics or programming to create these mathematical expressions. FlexSim has a tool called the Distribution Chooser that will help you select an appropriate statistical distribution to randomly calculate any kind of randomness. When you're done using the Distribution Chooser, it will create a mathematical expression based on the options you selected and it will automatically apply it to the daily demand or process times settings.
The Distribution Chooser is shown in the following image:
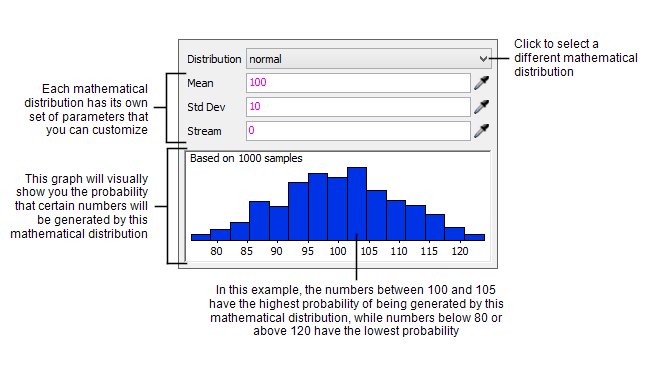
The Distribution Chooser allows you to select from thirty possible statistical distributions to generate random numbers. See Commonly Used Statistical Distributions for an overview of some of the frequently used distributions.
You can change the settings for each statistical distribution so that it uses different criteria or ranges of numbers to generate the random numbers. When you make changes to the settings, the blue bar graph will update to display the probabilities that certain numbers will be generated.
Using the Distribution Chooser
Many object properties are capable of using a statistical distribution. To use the Distribution Chooser for these properties:
- Click the arrow next to the property to open a menu.
- Select Statistical Distribution to open the
Distribution Chooser tool, as shown in the image below:
- Click the Distribution menu to select a different mathematical distribution if needed.
- Edit the specific parameters for that mathematical distribution to adjust the range and probability that certain numbers might be generated.
- Use the bar graph to check to see if the probabilities look accurate and make adjustments as needed.
- Click somewhere outside the Distribution Chooser to close the tool. You'll notice that the property's box will now show a mathematical expression based on the parameters you specified.
- If you need to choose a different distribution or you need to edit the parameters,
you can click the Properties button
 next to the property to re-open the
Distribution Chooser. Alternatively you can click inside the property's box and edit the
mathematical distribution directly.
next to the property to re-open the
Distribution Chooser. Alternatively you can click inside the property's box and edit the
mathematical distribution directly.
For more information about some of the different distributions and their parameters, read the next topics in this section.
Commonly Used Statistical Distributions
Some of the most commonly used distributions are:
- Exponential - Will randomly select most numbers near the beginning of a range of numbers. The frequency that numbers near the end of the scale will be generated decreases exponentially. This is the default distribution strategy because it is the distribution strategy most commonly found in the real world.
- Duniform - Will randomly select any whole numbers within a specific range. If you want to be able to include numbers with decimal points, use the Uniform distribution strategy instead.
- Normal - Has a distribution strategy similar to a bell curve in which numbers in the middle of the distribution scale are more likely to be generated at random.
- Triangular - Similar to the normal distribution strategy, but has a greater range of numbers in the middle of the distribution scale that are more likely to be generated at random.
- Uniform - Will randomly select any numbers within a specific range. The Uniform distribution strategy will include numbers with decimal points. If you'd rather only create whole numbers, use the Duniform distribution strategy instead.
Each of these distributions will be discussed in more detail in the following sections.
The Exponential Distribution
The Exponential distribution will randomly select most numbers near the beginning of a range of numbers. The frequency that numbers near the end of the scale will be generated decreases exponentially. This is the default distribution strategy because it is the distribution strategy most commonly found in the real world. The following image shows an example of the Exponential distribution strategy:
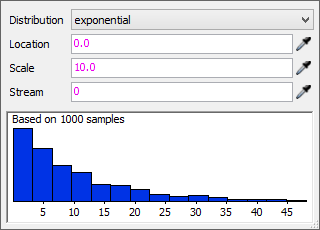
The Exponential distribution has three settings:
- Location - Sets the beginning of the range of numbers. Most of the random numbers generated will be roughly close to the number you use for this parameter.
- Scale - Sets the mean of the distribution and affects the overall pitch of the curve.
- Stream - Determines which one of FlexSim's random number streams should be used to generate these random numbers. Typically you won't need to edit this parameter.
When you make changes to the settings, the blue bar graph will update to display the probabilities that certain numbers will be generated. Usually, the bar graph doesn't change much for the Exponential distribution, but the range of the numbers listed on the bottom of the graph will change.
The Duniform Distribution
The Duniform distribution will randomly select numbers within a specific range. If you want to be able to include numbers with decimal points, use the Uniform distribution strategy instead. The following image shows an example of the Duniform distribution strategy:
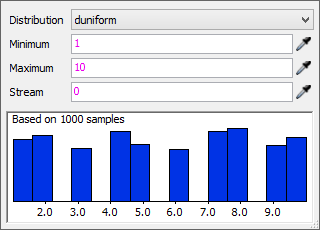
The Duniform distribution has three settings:
- Minimum - The lowest possible number that might be generated at random.
- Maximum - The highest possible number that might be generated at random.
- Stream - Determines which one of FlexSim's random number streams should be used to generate these random numbers. Typically you won't need to edit this parameter.
The Normal Distribution
The Normal distribution has a distribution strategy similar to a bell curve in which numbers in the middle of the distribution scale are more likely to be generated at random, as shown in the following image:
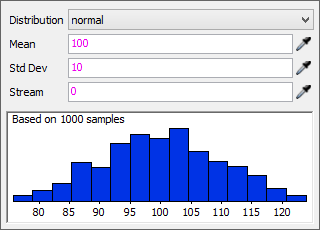
The Normal distribution has three settings:
- Mean - The most common number on average that will be generated at random.
- Standard Deviation (Std Dev) - The amount of variation or dispersion of values relative to the mean. A lower standard deviation will cause the numbers to be very close to the mean. A higher standard deviation will generate numbers that are more widely dispersed from the mean.
- Stream - Determines which one of FlexSim's random number streams should be used to generate these random numbers. Typically you won't need to edit this parameter.
The Triangular Distribution
The Triangular distribution is similar to the normal distribution strategy, but has a greater range of numbers in the middle of the distribution scale that are more likely to be generated at random, as shown in the following image:
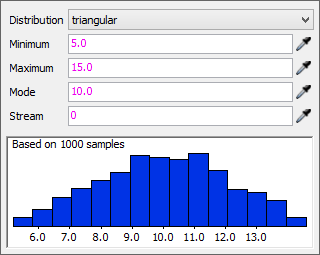
The Triangular distribution has four settings:
- Minimum - The lowest possible number that might be generated at random.
- Maximum - The highest possible number that might be generated at random.
- Mode - The most common number that will be generated at random.
- Stream - Determines which one of FlexSim's random number streams should be used to generate these random numbers. Typically you won't need to edit this parameter.
The Uniform Distribution
The Uniform distribution will randomly select numbers within a specific range. The uniform distribution strategy will include numbers with decimal points. If you'd rather only create whole numbers, use the Duniform distribution strategy instead. The following image shows an example of the Uniform distribution strategy:
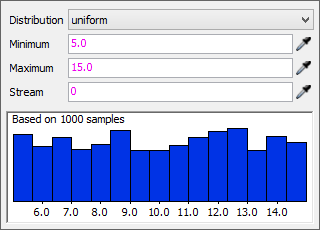
The Uniform distribution has three settings:
- Minimum - The lowest possible number that might be generated at random.
- Maximum - The highest possible number that might be generated at random.
- Stream - Determines which one of FlexSim's random number streams should be used to generate these random numbers. Typically you won't need to edit this parameter.