Zone Statistics vs Time Template
Overview and Key Concepts
This template is a Zone template. It assumes that you already have a Zone in a process flow in your model, and that you want to create a chart based on statistics from that Zone, not including partition statistics.
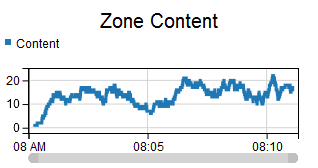
This template creates a time plot. The time plot will show the value of the chosen statistic through time. If you choose a local Zone of an instanced flow, then each instance object will appear as its own colored line on the chart.
The Options Tab
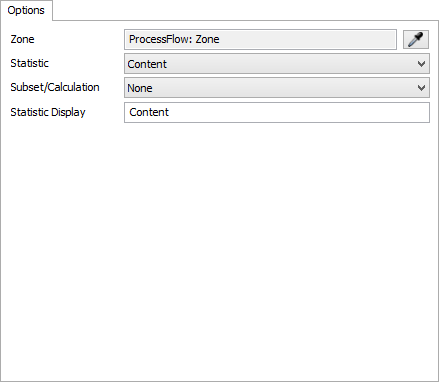
The Options tab has the following properties:
- Zone - Specifies the Zone to use as a data source.
- Statistic - Specifies which statistic to collect from the Zone. If you want to gather a Partition statistic, use the Zone Partition Statistics vs Time template, instead of this template.
- Subset/Calculation - Specifies the Subset or Subset Calculation to use, based on the chosen statistic. For more information, see Zone Statistics Table.
- Statistic Display - Specifies the name of the statistic in the legend. If the Zone is a local instanced Zone, this value will not be used.
The Settings Tab
The Settings tab is identical to the Time Plot Settings tab. For more information, see Time Plot Settings.
The Colors Tab
The Colors tab is identical to the Time Plot Colors tab. For more information, see Time Plot Colors.
The Advanced Tab
This template, like all templates, uses the Advanced Tab. For more information, see Advanced Tab.