Location Avg State Table Template
Overview and Key Concepts
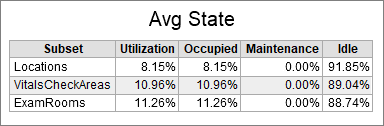
This chart template creates a table chart, and calculates utilization based on each object's time in various states.
The Tables/Metrics Tab
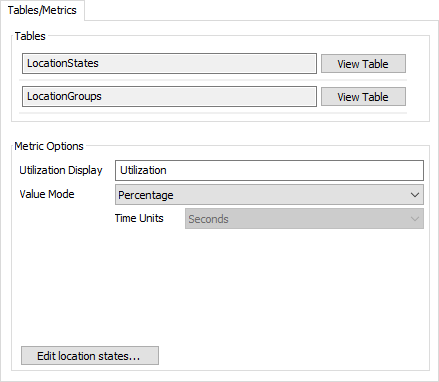
The Metric Options area has the following properties:
- Utilization Display - Specifies the name of the Utilization column in the table.
- Value Mode - Specifies how to display data for each state column. If the value mode is set to percentage, then the value displays the percent time spent in a given state. If the value mode is set to duration, the chart will show the average time spent in that state.
- Time Units - If the Value Mode is set to Duration, specifies the time units to use for durations shown in the table.
- Edit Location States... - Click this button to open the People Settings properties window, where you can edit the set of state
For information on the Tables area, or on the Tables/Metrics tab in general, see the People Templates topic.
The Options Tab
The options tab has the following properties:
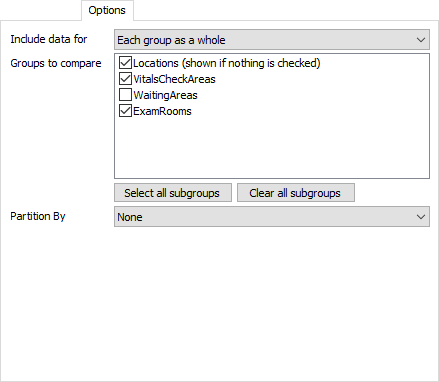
- Include data for - Specifies which objects
will be shown on the chart. There are three possible options:
- Each group as a whole - Shows data aggregated for each selected group.
- Each member of each group - Shows data for each individual in the selected groups. If an individual is in more than one group, they will be shown twice.
- Each group and each member - Shows data for a group followed by the individuals in that group for each selected group.
- Groups to compare - Choose which groups you would like to compare in the table. Each selected group will appear in the table in the Subset column.
- Select all subgroups - Click to select all groups except the top group.
- Clear all subgroups - Click to clear the selection of all groups except the top group.
- Partition By -
Choose how to partition result data within the table. There
are three available options:
- None - No partition will be used.
- By Hour of Day - Data will be partitioned by the hour of day, up to 24 hours.
- By Day of Week - Data will be partitioned by week day, Sunday through Saturday.
The Text Tab
The text tab is identical to the Table Chart's text tab. For more information, see the Table Chart topic.
The Advanced Tab
This template, like all templates, uses the Advanced Tab. For more information, see Advanced Tab.