Running Experiments
About the Experimenter and Optimizer
The Experimenter is a tool that runs the same simulation model multiple times, changing one or more variables each time to see if the results are different. The Experimenter also includes the Optimizer, which can give you a high-level overview of the conditions that will produce the best possible solution for the problem you are trying to solve through simulation.
Please read Key Concepts About Experiments before reading the rest of this topic.
Opening the Experimenter and Optimizer
To open the Experimenter and Optimizer:
- On FlexSim's main menu, click the Statistics menu.
- Select Experimenter.
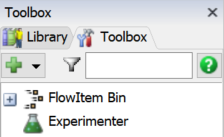
Once you've created an Experimenter, you can access it by double-clicking the Experimenter from the Toolbox.
Overview of the Experimenter/Optimizer User Interface
The Experimenter/Optimizer looks like a window that has multiple tabs. The tabs are organized in the order that you would use them to set up and run the Experimenter and Optimizer. You should start with the left-most tab (Scenarios) and change the necessary settings. Then, you should click the tab to its right and change those settings and so forth.
The following table explains the basic purpose of each tab:
| Tab | Purpose |
|---|---|
| Scenarios | You can use the table on the Scenarios tab to set up the basic conditions of your experiment. You'll use this tab to specify which variables you will test and how each variable will change in each scenario of your experiment. |
| Performance Measures | You'll use this tab to set up the objectives for your experiment. You'll indicate which statistics are your key performance indicators for the experiment, such as throughput, wait times, cost, etc. |
| Experiment Run | You will use this tab to run the actual experiment and monitor its progress until it is complete. You can also use this tab to determine how many replications you will run for each scenario. This tab can also control the data you will collect and export after the experiment is finished. |
| Optimizer Design | On this tab, you'll set up the variables, constraints, and objectives for the Optimizer run. You can also determine whether you want a range of solutions (recommended), a single solution, or a weighted solution. |
| Optimizer Run | You'll use this tab to run the Optimizer and monitor its progress until it is complete. If you didn't specify an end time, you'll also use this tab to stop an optimization run. |
| Optimizer Results | This tab displays the results of the optimization and its recommended solutions. You can also use this tab to export the data it collected. |
| Advanced | The Advanced tab has many different triggers that you can use to change aspects of the simulation model when an experiment or replication starts or ends. This tab is useful if you want something specific to happen in the simulation model that you can't change until the actual model begins to run. |
Designing Scenarios and Testing Variables
To design the scenarios and test the variables in your experiment, you will use the Scenarios tab in the Experimenter, which is shown in the following image:
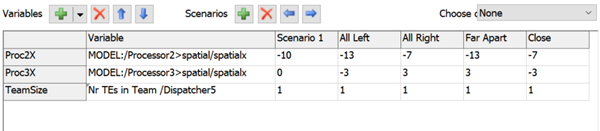
The Scenarios tab is a table where each row represents a variable that you will test and each column represents a different scenario. (See Key Terms for more information about these terms.) You can add or remove scenario columns using the Add and Remove buttons as needed. In that same vein, you can add or remove variable rows by changing the number in the Experiment Variables box.
If you double-click the heading cells, you can change the text that is displayed in each heading to give each variable or scenario a custom name.
Adding and Changing Variables
To determine which variable will change in each scenario:
- In the Variables group, click the arrow next to
Add button
 to open a menu. Select the type
of variable you want to change during different scenarios in the experiment.
to open a menu. Select the type
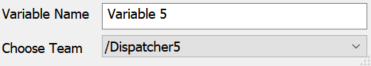
of variable you want to change during different scenarios in the experiment. - After selecting the type of variable from the menu, a small dialog box will pop up that will allow you specify exactly which variable you want to test. The dialog box will vary based on the variable you selected. For example, if you choose Number of Task Executers from the menu, the dialog box will look like the following image:
- In the Variable Name, type a nickname for this variable.
- Select the specific variable you want to test using the rest of the properties in the dialog box.
Adding and Changing Scenarios
Now that you have specified which variable you want to test, you will use the Scenario columns to indicate how each variable will be different in each scenario. To change the variables in each scenario:
- Click a cell listed under the Scenario column.
- Type the value you want the variable to have when this scenario runs.
For example, imagine that you want to find the ideal number of operators your model will need in order to reduce processing times. You would create a Scenario column for each operator. In the first Scenario column, you would type the number 1. That means that you would test how your simulation model runs with only one operator. In the second Scenario column, you would type 2 to test the model with two operators, and so forth.
Defining the Experiment's Goals
You need to determine the goals of the experiment by defining which key performance indicators you'll use to measure success or failure of a particular scenario. Then, you'll need to connect the Experimenter to the specific statistics you are using to measure the outcomes of your business system. You'll use the Performance Measures tab to do this, as shown in the following image:
Adding a New Performance Measure
To add a new performance measure:
- On the Performance Measures tab, click the
Add button
 .
. - In the Name box, type a nickname that you'll use to identify this key performance measure.
- In the Label for Y-axis box, type the display name you want to use for the Y-axis on the chart that will display the performance measure results for the experiments.
- Click the arrow next to Performance Measures box to open a menu of different options for statistics. Select the option that seems closest to the category of statistic you want to use.
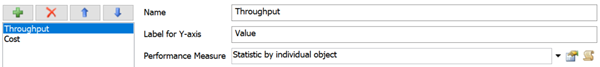
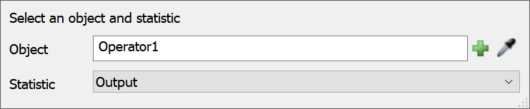
- After selecting the statistical category from the menu, a small dialog box will pop up that will allow you specify exactly which statistic you want to measure. The dialog box will vary based on the statistical category you selected. For example, if you choose Statistics by Individual Object, the dialog box will look like the following image:
- Use the prompts on the dialog box to navigate to the specific statistics you're interested in.
Running an Experiment
To run your experiment, you will use the Experiment Run tab in the Experimenter, as shown in the following image:
The following sections will explain the various stages of running an experiment.
Before Running an Experiment
You should strongly consider checking the Restore original state after replication checkbox on the Experiment Run tab before running experiments. This checkbox will ensure that each replication starts from the same starting state on reset and will help ensure accuracy.
The following checklist covers a few things you might want to consider doing on the Experiment Run tab before you run the experiment:
- Change the number of replications - You can change the Replications per Scenario setting to determine how many replications you should run. By default, the Experimenter will run three replications. But you can increase or decrease that number if needed.
- Edit the End Time and Run Time settings - You need to define a specific point in time that the simulation model will finish running. Remember that you'll want to run the simulation model long enough to collect data that will be representative of your business system over time. You can either set the end time using the End Time setting or Run Time settings. Both settings are connected: when you edit one setting the other setting will automatically update.
- Add a Warmup Time if needed - A warmup time is the amount of time it will take the model to reach a steady state or to get to its normal operating capacity. After the model warmup time, the simulation model will reset the statistics it's collecting.
- Save output data if needed - You can check the checkboxes that allow you to save Dashboard data or states for each replication if you want to export the results for each replication. You might also want to ensure that your Dashboard is set up to track the correct information before you run your experiment.
Running an Experiment
Click the Run Experiment button to begin the experiment. After a moment, the Experiment Status progress bars will appear in the middle of the Experiment Run tab.
Each scenario will have a progress bar divided into sections for each replication that you are running. As you watch, the red bar will gradually turn green, indicating the progress of the simulation run. When all the bars are green, the experiment is finished.
If you would like to run the experiment again, click the Reset Experiment button to erase the Experiment Status progress bars. Click the Run Experiment button to repeat the experiment.
After Running an Experiment
When you're done running the experiment, click the View Results button to open a separate window with the results. The Experiment Results window has three tabs:
| Tab | Purpose |
|---|---|
| Performance Measures | This tab will display the results of the experiment for each performance measure that you defined. Use the menu to select the specific performance measure you want to display. |
| Dashboard Statistics | This tab will display dashboard charts from any of the scenarios and replications you are interested in exploring. Be aware that you need to first add the charts you are interested in to your Dashboard in your simulation model before you can use this tab. |
| Console Output | Use this tab to check that there weren't any errors in your simulation models when you ran the experiment. This tab will allow you to check the console output for each replication for any console error messages. Make sure you don't skip looking at this step. |
The following image shows an example of the experiment results for one set of experiments:
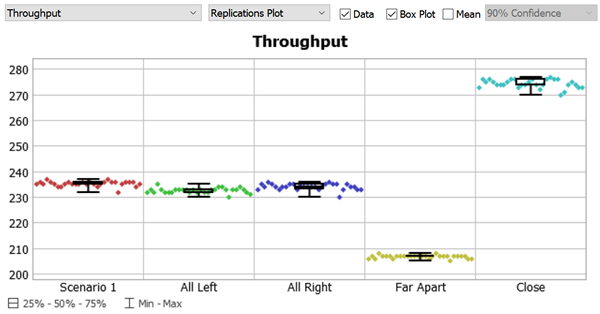
In this case, the experiment shows that placing processors closer together dramatically increases the system's throughput.
The following image shows an example of the Dashboard Statistics for one replication in the Experimenter:
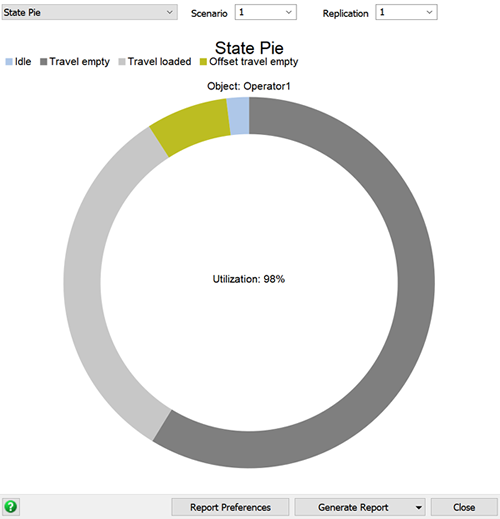
You can view any chart for any replication as needed.
Designing an Optimization
You'll use the Optimizer Design tab to set up an optimization, as shown in the following image:
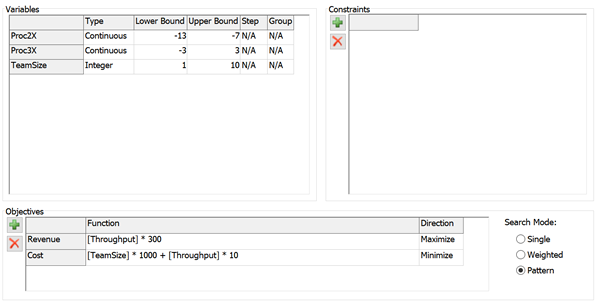
Adding Variables
When you first open the Optimizer Design tab, you'll notice that the Variables table displays the same variables you used on the Scenarios tab. Therefore, if you want to add, change, or remove any of these variables, you'll need to add them on the Scenarios tab first.
After you've added the variables on the Scenarios tab:
- Click the cell under the Type box and select the type of variable this is from the menu. This menu has the following options:
- After selecting the variable type, you will need to define the rest of the cells for that variable. Different cells and options will be available depending on which type of variable you selected from the menu. If a cell is unavailable, it will display N/A. If it is available, you should fill out that cell.
| Type | Description |
|---|---|
| Continuous | Use this for variables that can have a range of possible values, including decimals or negative numbers. Values that can be very finely tuned (such as positions, lengths, and times) are often represented as continuous variables. |
| Integer | Select this option if you want to choose from a range of possible values, but only whole numbers. Quantities of discrete objects (number of people, items, etc.) are often represented as integer variables. |
| Discrete | These variables represent options with a range of possible values and a step between possible values. Only values that are exactly n steps from the lower bound are valid. Values with discrete steps (part sizes, paired items, etc.) are often represented as discrete variables. |
| Binary | For variables that can only have two possible values: 0 and 1 (true or false). Values that represent options like yes/no, on/off, present/not present, etc., are usually represented as binary variables. |
| Design | These variables represent options that have a range, but a higher value does not represent "more" or "further." Instead, it just represents a different option. The Optimizer will not assume that increasing this kind of variable will have a predictable effect on the system. Values that represent options like machine type, overall floor layout, or packing strategy are usually represented as design variables. |
| Permutation | These variables are usually used to represent a sequence of steps that can be completed in different orders. For example, a part route could be represented with a permutation variable. In one configuration, Station 1 could be first, Station 2 second, and Station 3 third. In another configuration, Station 3 could be first, Station 1 could be second, and Station 2 could be third. |
Adding Objectives
You need to define what success looks like so that the Optimizer can determine which solutions best meet that definition. You'll do this by adding your specific goals to the Objectives table in the Optimizer Design tab.
Be aware that you have to express the objectives in terms of a simple equation. For
example, if the items produced by the system can be sold for $300.00, you could calculate
revenue as: [Throughput * 300].
Fortunately, these equations can include references to variables that you've already
defined in the Experimenter. For example, if you created a variable on the Scenarios tab
called TeamSize that includes the number of operators that will be used in the
system, you could reference this variable using its name in brackets in the objective as
[TeamSize].
Not only can you reference variables from the Experimenter, you can also reference the names of any performance measures that you defined in the Experimenter. For example, if you created a performance measure named Throughput that is linked to a statistic on an object in the 3D model, you could reference that performance measure in your objective.
For example, imagine you wanted to calculate the cost to produce items. Imagine that
wages for the workers equaled $1000 per worker and the materials needed to produce an item
cost $10. You could use the following expression as your objective: [TeamSize] * 1000
+ [Throughput] * 10.
One thing to be aware of is that the third-party software that runs the Optimizer isn't designed to read FlexScript expressions as objectives. Fortunately, you can use FlexScript expressions when defining variables and performance measures in the Experimenter. So you can incorporate your own custom code using those indirect methods.
Choosing a Search Mode
The search mode will determine how many solutions the Optimizer will try to find. Generally, you should use the default option, which is the Pattern method. The following table describes each of the options:
| Search Mode | Description |
|---|---|
| Single | The Optimizer will try to maximize or minimize a single objective. After the Optimizer runs for the amount of time you specified, it will return its recommendation for the most optimal solution. |
| Weighted | The Optimizer will try to maximize the cumulative value of all given objectives. Each objective is given a weight and a direction. If a particular objective is to be minimized, its value is multiplied by -1 before it is added to the cumulative objective. The best solution found in the time given will be returned. |
| Pattern | This is the default search mode and the recommended mode. The Optimizer will search for a range of solutions that optimize all given objectives. This search mode returns a set of optimal solutions. They are optimal in that for each one, improving any objective worsens the others. For example, a given optimization may maximize profit and minimize cost. For the Optimizer to highlight a solution as optimal, no other solution can exist that increases profit without increasing cost. |
Adding Constraints
Constraints are a way of specifying additional conditions that a given model must maintain. The Optimizer will only mark a configuration as optimal if it is feasible within the constraints you've defined.
As a general best practice, you should build any constraints directly into your 3D model whenever possible. However, you might occasionally need to enforce additional constraints. You can do this using the Constraints table in the Optimizer Design tab. Constraints are mathematical expressions that result in boolean values. They can be composed of variables, performance measures, literal values, and basic mathematical functions. See Reference - Experimenter and Optimizer for more information about valid expressions.
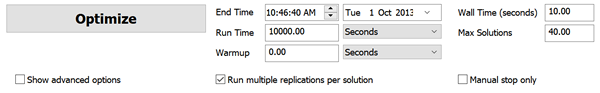
Running an Optimization
To run an optimization, you will use the Optimizer Run tab in the Experimenter, as shown in the following image:
The following sections will explain the various stages of running an optimization.
Before Running an Optimization
The following checklist covers a few things you might want to consider doing on the Experiment Run tab before you run the experiment:
- Update the End Time, Run Time, and Warmup settings if needed - The End Time and Run Time settings will automatically use the same settings that you used on the Experiment Run tab. If you edit them here, it will also change those settings on the Experiment Run tab as well. If you want the Optimizer to ignore these setting so that you can manually stop it, you could check the Manual stop only button.
- Determine how many solutions you want - Type the number of solutions you want to explore in the Max Solutions box. When deciding how many solutions you want the Optimizer to explore, keep in mind that you need to be aware of your computer's processing capabilities and whether it can handle exploring a large number of solutions.
Running an Optimization
Click the Optimize button to begin running the Optimizer. After you press this button, the window will automatically switch to the Optimizer Results tab where the results will begin displaying real time.
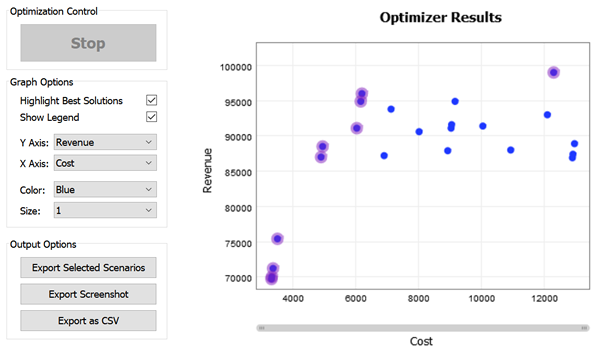
Analyzing Optimizer Results
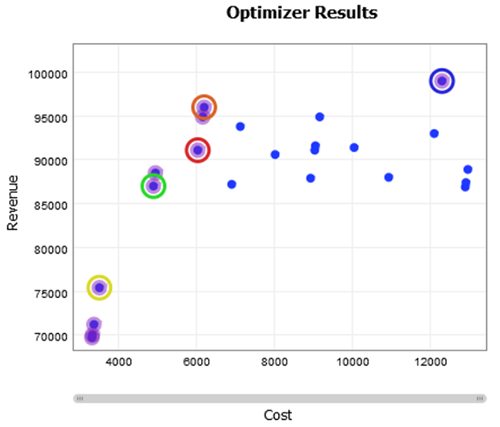
Once you've gotten the Optimizer's recommended solutions, you can explore which scenarios and variable settings were able to generate those solutions. You'll mostly use the Optimizer Results tab to analyze the results, as shown in the following image:
The following sections explain different ways you can analyze the Optimizer's results.
Selecting Solutions
First, you need to select the solutions you are most interested in exploring. To select a solution to explore:
- Point to a solution in the Optimizer Results graph. As you hover over it, you'll notice a light gray ring will appear around it.
- Click the solution to select it. The selected solution will then display a colored circle around it to indicate that it is selected.
- Click additional solutions as needed. Each solution will automatically be assigned a unique color, as shown in the following example:
Viewing Inputs and Outputs for Selected Solutions
Once you've selected the solutions you're interested in, you can use the controls in the Graph Options group to change which results are displayed in the Optimizer Results graph. These controls can affect which data inputs and outputs you can view.
As you change the graph options, you can see where the solutions you selected now fall on the graph, as shown in the following image:
Be aware that you can point to a specific solution with your mouse to see pop-up text that will describe the exact Y- and X-axis statistics for that solution.
Exporting Selected Scenarios
You can export selected scenarios from the Optimizer to the Experimenter if needed. You can export the scenarios by clicking the Export Selected Scenarios button. When you click this button, the window will immediately switch back to the Scenarios tab. The scenarios you selected will be appended as new columns at the end of the Scenarios table. Be aware that you might have to scroll to the right in order to see the Scenarios you selected in the table.
There are a few reasons why it might be helpful to export to the Experimenter:
- See the variable settings for selected solutions. If needed, you can export the selected scenarios to the Scenarios tab so that you can view their exact settings for each of the conditional variables. Be aware that you can also view the settings by changing the settings in the Graph Options group too.
- Run more replications of the selected solutions. To ensure that your statistical averages for a given solution are valid, you might want to run some additional experiments on those solutions, increasing the number of replications you run.
- Choose a specific scenario and watch the 3D model for it run in real time. You might want to see a model run of one of the solutions in real time. You'd need to export the solution to the Experimenter first in order to do this.
To run a specific scenario in real time:
- On the Optimizer Results tab, click the solution(s) you want to see in real time.
- Click the Export Selected Scenarios button. The window will automatically switch to the Scenarios tab.
- Click the Choose default reset scenario menu to open it. Select the scenario that you'd like to run in the 3D model.
- On the simulation control bar, press the Reset button to change the model to that scenario. Then press the Run button and watch the model as normal.
Exporting Screenshots
You can export an image file in .png format of the Optimizer Results graph as needed:
- Check the Graph Options settings to ensure that you have selected the correct graph display settings.
- Click the Export Screenshot button.
- Navigate to the folder location where you want to store the image file.
- Type a name for the file and click the Save button.
Exporting .CSV Files
You can export a spreadsheet in the .csv file format as needed. Be aware that the Optimizer will export the data from the full Optimizer results, not just selected solutions.
To export a spreadsheet of the results:
- Click the Export as CSV button.
- Navigate to the folder location where you want to store the file.
- Type a name for the file and click the Save button.
Querying Statistic Collector Results
If you set up a Statistics Collector to gather custom statistics from your 3D model, the Statistics Collector will run in the background for all replications in any experiments or optimizations. At this point, you need to create a Calculated Table in order to view the raw data from these experiments.
If you are comfortable writing SQL queries, you can import the raw data from these
experiments using the Experiment.MyStatisticsCollector keyword. See
SQL
Queries for more information. If you are not comfortable with SQL Queries, you can
contact FlexSim
Customer Support for assistance.