Using the Statistics Collector
About the Statistics Collector
Before reading this topic, consider reading Key Concepts About Getting Data to ensure you are familiar with the overall processes and tools that are involved in getting data from a simulation model.
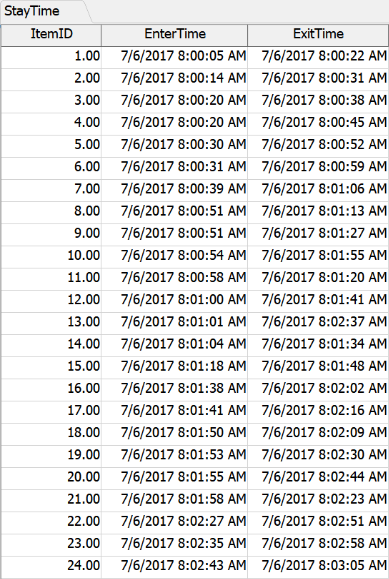
The Statistics Collector is a tool that will gather raw data from the objects and events you specify during a simulation run. During a simulation run, a statistics collector will listen to these objects and put the raw data into a data table, such as the one shown in the following example, which tracks the time at which items enter and exit and assembly line:
Once you've collected this raw data, you could possibly:
- Transform the data using the Calculated Table tool. (See Using the Calculated Table for more information.)
- Visualize the data using some of the charts available within FlexSim.
- Export the data to an external software program such as Excel or Tableau.
The Statistics Collector has two main advantages:
- It can easily adapt to meet your unique data-gathering needs. You can customize statistics collectors to gather data from nearly any event or statistic that is available during a simulation run. At the same time, the statistics collector won't guess about what data you might want and only gives you exactly what you asked for. Nothing more and nothing less. In other words, the statistics collector lets you determine exactly what data you want to gather while also allowing you to filter out any unnecessary data that you don't want.
- It gives you direct access to your simulation model's raw data. While it is sometimes useful to create charts to visualize the results of a simulation model, sometimes it's more useful to have access to the raw data from a simulation run itself. Using statistics collectors, you won't need to create a chart to get information from simulation run. All your raw data will be available in data tables that you create and define. Using the data from these tables, you can then perform more calculations, display the data in a chart in FlexSim, or export the data for further analysis using your preferred data analysis software programs.
Overview of Using the Statistics Collector
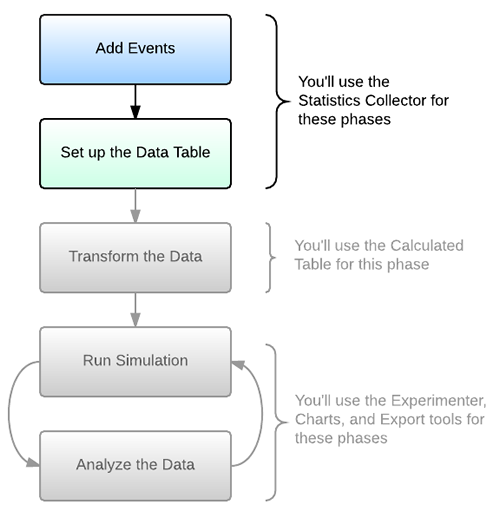
If you'll recall from reading the Overview of Advanced Data Gathering, there are five basic phases involved in getting custom data from a simulation model. The Statistics Collector is involved in the first two phases:
Before using a statistics collector, you need to determine:
- Which events should the statistics collector listen to?
- Which data should it record when that event occurs?
- How should it collect, update, and display that data in the data table?
The answer to those questions will depend on the specific decision you're trying to make or the problem you're trying to solve by building a simulation model. (See Determining Your Key Metrics for more information about how to determine the kind of data outputs you are most interested in.)
Once you've determined which data you're interested in, you'll first set up a statistics collector to listen to the events associated with that data. Then you will set up the rows and columns on the data table to update and display your raw data. The rest of the sections in this topic will explain how to do these tasks in more detail.
Creating a New Statistics Collector
One important concept to keep in mind is that each statistics collector will always have a data table associated with it. If you would like to create multiple tables that will each track different raw data, you should create a separate statistics collector for each table.
You can add, manage, and delete statistics collectors using the Toolbox. See Using the Toolbox for more information.
Adding Events to the Collector
The first step in setting up a statistics collector is to add the events it will listen to. You'll use the Event-Listening tab on the statistics collector to add the events:
The Event List is on the left side of this tab. The Event List displays all the events that the statistics collector is currently listening to. You'll need to add simulation events to this list if you want the statistics collector to listen to them. (See Types of Events for more information about the types of events a statistics collector can listen to.)
Adding Events Using the Sampler Button
The Sampler button is the simplest way to add an event to the Event List. It can sample nearly any type of event except timer events. To add a timer event, you'll have to use the Add menu instead.
To add an event using the Sampler button:
- Click the Sampler button
 to enter sampling mode.
 - Click the object you want the statistics collector to listen to during a simulation run. The method you will use for sampling the object might differ based on the type of object you are sampling:
- When you click the object, it will open a menu listing all the events that are available for this type of object. Select the appropriate event from the list.
| Type | Explanation |
|---|---|
| 3D Object | Click an object in the 3D model to sample it |
| Process Flow Activity or Shared Asset | Click an activity or shared asset in a process flow to sample it |
| Groups | In the Toolbox under Groups, click the name of the group to sample it |
| Tracked Variables | In the Toolbox under Tracked Variables, click the name of the variable to sample it |
The event you selected will now show up in the event list. You can add additional events if you want to listen to multiple events on the same object.
Adding Events Using the Menu
You can use the Add button  to select an event
using the menu instead. Be aware that this is the only method for adding timer events to a
statistics collector.
to select an event
using the menu instead. Be aware that this is the only method for adding timer events to a
statistics collector.
To add a timer event:
- Click the Add button
to open a menu.
- Select Add Timer Event.
- The timer event will appear in the event list with the default name of Timer. You can change this name in the Event Details if needed.
Changing the Object or Event
If needed, you can change the object or event in the Event Details properties.
Editing Event Details
After you've added an event to the Event List, you can edit the events using the properties in the Event Details group. These properties are context-sensitive, meaning that different properties will be available depending on the type of event that is currently selected in the Event List. (See Types of Events for more information about the types of events a statistics collector can listen to.)
You can use the Event Details to:
- Create Labels from Event Parameters - Object-based events have specific parameters associated with them. These parameters contain basic information about the event, such as which flow item or token triggered the event. You can use the Event Details properties to preserve any relevant information from these parameters with a custom label.
- Record Data from Other Labels - If there is a label on a flow item or token that could contain relevant information at the time an event occurs, you can set up the statistics collector to capture the current value of the label at the moment the event occurs. For example, you could record the value of a label that tracks an item's product type or you could record the value of a label that tracks the item's current weight.
- Define a Change Rule - You might want to set up a change event, which are events that listen for any statistical change to occur on a 3D object or process flow activity. You'll use the Event Details properties to determine the conditions that will trigger the statistical event, also known as the change rule.
- Set Up a Timer Event - Statistics collectors can collect data at regular timed intervals. When the timed event fires, it can collect data from various objects in the model at that moment in time. You will edit the event details to determine how frequently the timer event captures data from the model.
- Give Your Event a Custom Name - You can change the event's name if needed.
- Change the Object or Event - If you selected the wrong object but would still like to use that specific event (or vice versa), you can make that change here.
- Add a Condition - If you want to further filter or restrict the events that the statistics collector listens to, you could add a condition that tells the statistics collector which events to record or ignore. For example, you could specify that it should only record an event if the value of a label on the flow item meets some criteria, such as having a ProductType label value equal to 2.
The following sections will explain how to edit the event details for these purposes.
Creating Labels from Event Parameters
Object-based events have specific parameters associated with them. Often these parameters reference the specific flow item or token that triggered the event. Sometimes the parameters might indicate the number of the port through which the item was sent or received. Or a task executer might have the ability to record where it loaded an item. See Label Matching for more information.
If you're interested in preserving any of this information, you can create a label that will capture this information so that it can be displayed in the data table. When you set up the columns for the data table later in the process, you will need to reference this specific label name in order to get the value of the label into the data table.
To create labels from the event parameters:
- Select an object-based event in the event list.
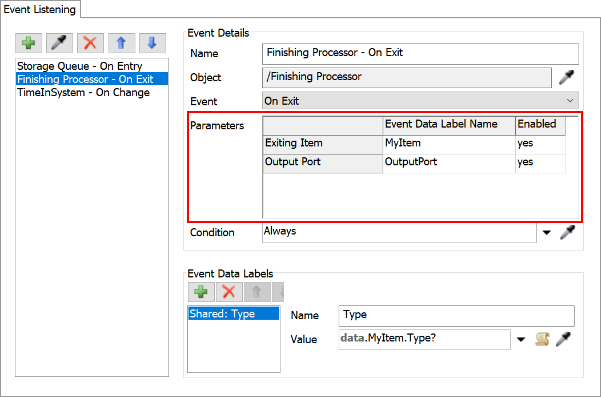
- In the Event Details group, look for the Parameters table. This table lists all the event parameters for that specific event. To learn more about what a specific event parameter tracks, see the reference page for that particular object.
- By default, all the event parameters have an yes in the Enabled column. This means that the statistics collector can collect data from this parameter. To disable a parameter, click inside the cell and select no from the menu.
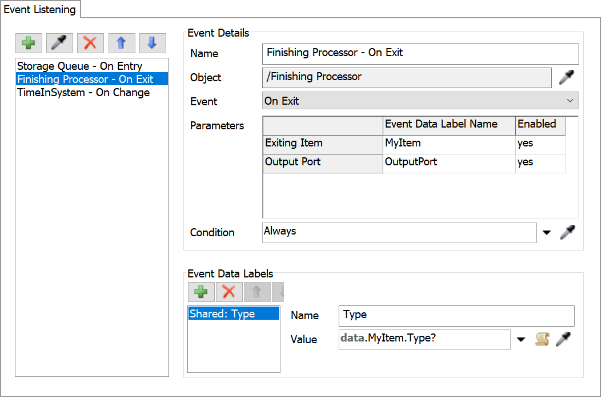
- In the Event Data Label Name column, you can change the name of the label that stores the information from this parameter. For example, in the preceding image, the default label for the Entering Item parameter is EnteringItem. In this example, the label has been changed to use the custom label MyItem instead. To change the name, click inside the cell and type a new label name.
- If desired, you can use the Condition box to further restrict whether the statistics collector will record an event or not. The default option is Always, meaning the event will be recorded any time it occurs. Use the arrow next to this box to open a menu and explore possible options.
Recording Data from Other Labels
If there is a label on a flow item or token that could contain relevant information at the time an event occurs, you can set up the statistics collector to capture the current value of the label at the moment the event occurs.
- Select an object-based event in the event list.
- In the Event Labels group, click the
Add button to open
a menu.
- Select Add label for this event if you only want to get this label's data when this event fires. Select Add label for all events if you are certain that all events on this statistics collector will need access to the same data. Otherwise, use the first option.
- In the Name box, type a descriptive name for the label.
- Use the Value box to either set the initial value of the label or get the label's current value. Use the arrow next to this box to open a menu and explore possible options.
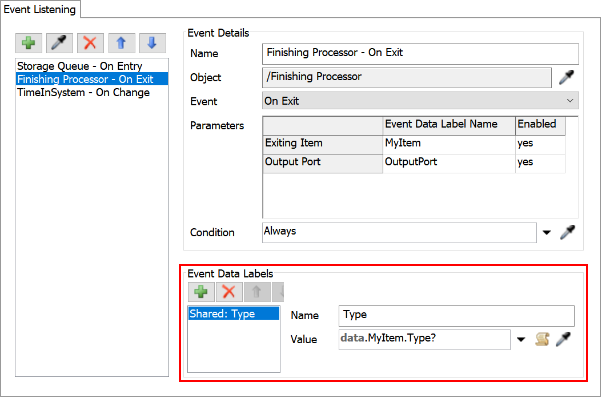
This label's value can now be referenced in the data table.
Defining a Change Rule
You might want to set up a change event, which are events that listen for any statistical change to occur on a 3D object or activity. You'll use the Event Details properties to determine the conditions that will trigger the statistical event, also known as the change rule.
To define a change rule:
- Make sure that the event selected in the event list is a change event.
- In the Event Details group, open the Change Rule menu and select the change rule you want to apply to this event. For example, if you want to track any change, you would select Change. If you want to track any increase, you would select Increase.
- If needed, enter the Change Value that will trigger the event to fire.
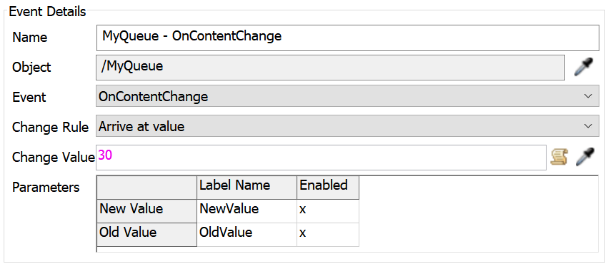
In the example shown in the preceding image, the change rule is set to fire the event when the queue reaches a content of exactly 30 flow items.
Setting Up a Timer Event
The event details for a timer event will depend on whether you want the timer event to record information at regular intervals or not. See the section on Setting Up Timer Events for more information.
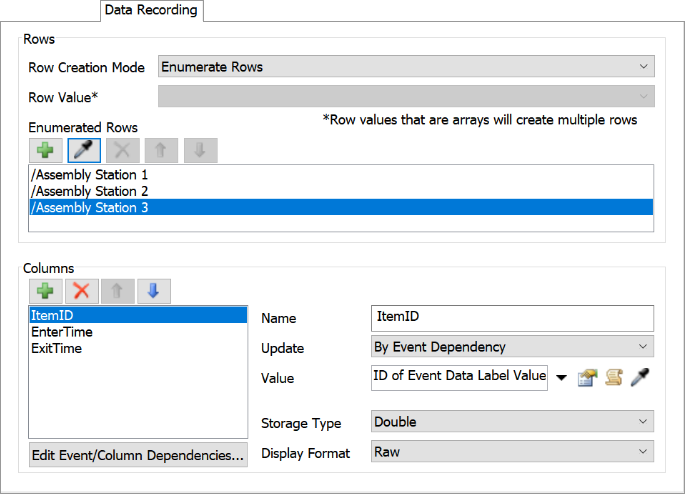
Choosing How the Data Table Will Create Rows
Once you've added an event and edited the event's details, you'll work on setting up the data table for your statistics collector. Specifically, you will need to decide how the data table will add new rows to the table and what kind of information will be recorded in the columns of the table. You'll use the Data Recording tab in the collector to do this:
You'll start by defining the data table's rows. Statistics collectors have three row creation modes that determine how rows are added to the table during a simulation run:
| Row Mode | Explanation | When to Use It |
|---|---|---|
| Add Per Event | Adds a row to the data table every time one of the events the statistics collector is listening for occurs. The data table will grow longer every time an event occurs. | This row mode might be best for timer events. It will create a row every time
the event timer fires and capture the data from the relevant objects at that moment
during the simulation run. You could also use this row mode if you want to simply see a log of all the events that currently being recorded by the statistics collector. |
| Unique Row Values | Adds a row for unique values. If the value is unique, it will create a new row. If the value is not unique, the data table will update or fill in values for certain columns on that row. When you choose this row mode, you will select the value that will be checked for uniqueness, such as a data event label. | This row mode is ideal for tracking a flow item or token as it moves through a
model or process flow. As the flow item or token causes events to fire, it can
update the columns in the row with new information as needed. This row mode is also ideal for tracking unique values on a label. For example, it could create rows for each SKU number on an item's label, or it could create rows for each product type, etc. |
| Enumerate Rows | Adds a row for each object that is specified in the Enumerated Rows list. When this row mode is selected, you can fill in the Enumerated Rows list with the objects that will make up the rows of the table. | This row mode is ideal when you have a fixed number of objects for which you want to collect information. For example, this could be ideal if you want to track object statistics like the object's total throughput. |
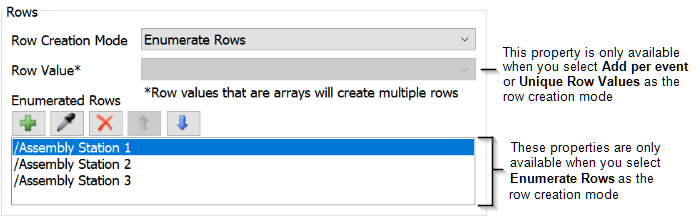
To configure the rows in your data table:
- In the Rows group, open the Row Creation Mode menu and select the appropriate row mode for your data table. (See the preceding table for an explanation of the different row mode options.)
- If you selected Unique Row Values as the row creation mode, you will need to use the Row Value menu to select the label that will be used to create new rows. If you selected Add Per Event, this step is optional.
- If you selected Enumerate Rows, you will need to use the Enumerated Rows list to specify which objects or groups will comprise each row of the table.
You can test whether your data table adds rows correctly by viewing the table during a simulation run. While the simulation runs, you'll be able to observe when and how it creates new rows. But you can't test this until after you've added at least one column to the data table, so make sure you do that first.
Determining How the Data Table Will Update Columns
After setting up how the rows are added to the data table, you'll need to configure the columns in your table. Before setting up your columns, you might want to take a moment to think through the logic of your data table. Brainstorm the answer to the following questions:
- How many columns will be in the data table?
- Which information the columns will record?
- When or how data will be added or updated in the column?
The answer to these questions will depend on your purpose in getting data from your simulation. Once you've got a rough idea of how the data table will be configured, you're ready to create the data table's columns.
One thing to keep in mind with the columns is that if you don't explicitly create a column to display something, the data table will not display it. So, for example, if you decided to add a row for each unique item, the data table will not display the item ID unless you specifically add a column that will display that value. So, as a general best practice, you might want to create a column that displays the value for the object or label value that prompted the creation of a new row.
To create a column in your data table:
- In the Columns group, click the
Add button to open
a menu.
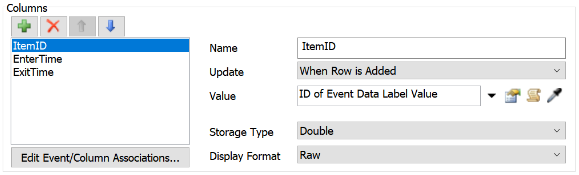
- In the Name box, type the name you want the column to have. Be aware that this will become its display name.
- Click the Update menu and select when the table will
update the contents of the columns. The options are:
- By Event Dependency - The columns will update when the events fire. If you choose this option, you'll need to use the Edit Event/Column Associations button to determine which columns should be updated when certain events fire.
- When Row is Added - The column will only update one time: when the row is first created.
- Always - The columns will refresh:
- When you are viewing a data table, it will update every time the screen paints.
- When a chart is using this statistics collector, it updates every time the screen paints.
- When you run a query on this statistics collector's table, it updates before the query executes.
- In FlexScript expressions when you use the
Tableconstructor and pass in the name of (or reference to) a statistics collector, then the values set to Always will update.
- Next, you'll use the Value box to determine which data will be displayed in the column. Click the menu next to this box to explore the possible options. The following table describes a few common values that you might want and how to select them from the menu:
- Ensure that you matched the label for the flow item or token in the event's parameters on the Event Listening tab. (See Editing Event Details.)
- In the Value menu, point to IDs, then select ID of Event Data Label Value.
- A picklist menu will pop up listing all the event data labels you have created in the statistics collector. Select the name of the label you assigned the flow item or token.
- Also change the Storage Type menu under the value box to Raw to display item or token IDs correctly.
- The Storage Type and Display Format will automatically update based on the selection you chose in the Value box, but it might be a good idea to review them to ensure they are accurate.
- Repeat the previous steps until you've defined all of the columns in your data table.
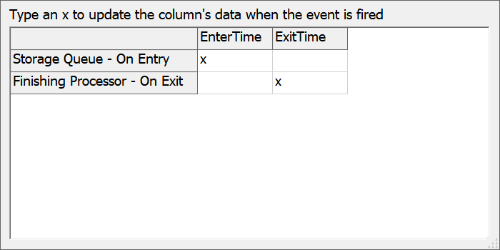
- If any of the columns you created are using the By Event Dependency update mode (see step 3), click the Edit Event/Column Associations button under the Column List. This will open the Event/Column Associations table:
- The rows display the events that the statistics collector is currently listening to. The columns show the columns that you have defined in the data table so far. Type an X in the cell that correlates with the event and column that you want to update when a particular event fires. Delete the X if you do not want that event to update that column.
- Press the OK button to save the changes and close the statistics collector.
| Value | Explanation |
|---|---|
| The ID of a flow item or token |
|
| The time an event occurred | In the Value menu, point to Time then select FlexSim Time to display use model time. You can also choose one of the other options as needed. |
| The 3D object or activity that caused the event | In the Value menu, point to IDs, then select ID of Event Object. |
After setting up your statistics collector, you should validate it to make sure you set it up correctly, which is discussed in the following section.
Viewing and Validating the Data Table
After setting up your data table, it might be helpful to validate that your data table is collecting and displaying the specific information you are interested in gathering. The best way to test this is to view your data table during or after a simulation run. You might also simply be interested in viewing the raw data directly in the table.
To open a Statistic Collector's data table:
- With the Toolbox open, under the Statistics Collectors group, look for the specific statistics collector you want to view.
- Right-click the statistics collector to open a menu. Select View Table.
The data table for that statistics collector will then show up as a new window in the model. If you have not yet run a simulation model, the table will be blank. You can reset and run the simulation model to watch it get populated in real time.
Exporting the Data Table
You can export the raw data collected in the statistic collector's data table in a comma-separated value file (.CSV). You can then import this file into a third-party data analysis software program such as Excel or Tableau as needed.
To export the data from a statistics collector table:
- Before exporting the statistics collector, ensure that you've run the simulation model so that the data table has is populated with the data you want.
- With the Toolbox open, under the Statistics Collectors group, look for the specific statistics collector you want to export.
- Right-click the statistics collector to open a menu. Select Export to CSV.
- Navigate to the computer folder in which you want to save your file. Give it an appropriate name and then save the file.
The file should now be saved on your computer. Double-check that your file now shows up in the appropriate folder.
Setting Up Timer Events
Statistics collectors can collect data at regular timed intervals. When the timed event fires, it can collect data from various objects in the model at that moment in time. You will edit the event details to determine how frequently the timer event captures data from the model.
This section will explain in more depth how to set up the event details for a timer event. It will discuss several different timer event scenarios and how to set up the event details for each scenario.
Regular Intervals
To cause timer events to record information at regular intervals:
- Set the First Time box to
0.00so that the event timer will begin when the simulation model begins to run. - Do not add any additional times to the Event Times table.
- Make sure the Repeating check box is checked.
- In the Repeat Time box, type a number for how frequently the event timer should fire in simulation time units.
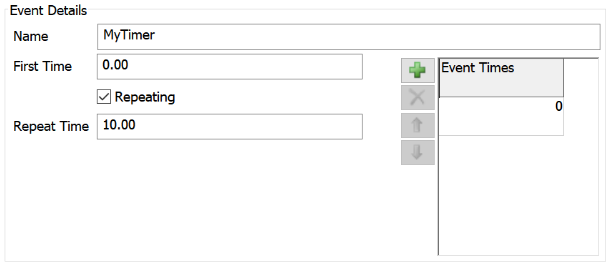
In the example shown in the preceding image, the timer event will fire every 10 seconds (in simulation time units).
Regular Intervals After a Warm-Up Period
You might want the simulation model to warm-up, meaning it needs to reach its standard operating capacity before you begin gathering data from it. For example, if you wanted to simulate a business system that operates at a constant rate 24 hours a day, 7 days a week, you would need your model to run for a period of time before it reached its normal operating levels.
- Set the First Time box to the time (in simulation model units) that the model will be fully warmed up.
- Do not add any additional times to the Event Times table.
- Make sure the Repeating check box is checked.
- In the Repeat Time box, type a number for how frequently the event timer should fire in simulation time units.
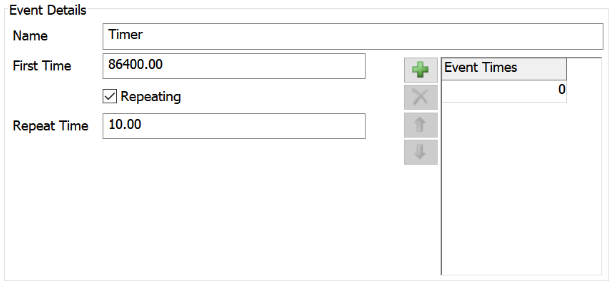
In the example shown in the preceding image, the timer will wait until the model has run for a full 24 hours (86,400 seconds). After that period, the timer event will fire every 10 seconds.
Repeating Irregular Intervals
If you want the timer event to fire on a custom schedule that will repeat itself:
- Set the First Time box to
0.00so that the event timer will begin when the simulation model begins to run. - If you want the interval schedule to begin at a time other than 0, in the Event Times table, change the time in the first cell to the time you want the interval to begin.
- Click the Add button
to add additional cells to the
Event Times table. Write the interval in simulation time
units that the next timer event should fire. Repeat this step until you've added all the
necessary intervals.
- Make sure the Repeating check box is checked.
- In the Repeat Time box, type a number for how frequently the irregular schedule should repeat itself in simulation time units.
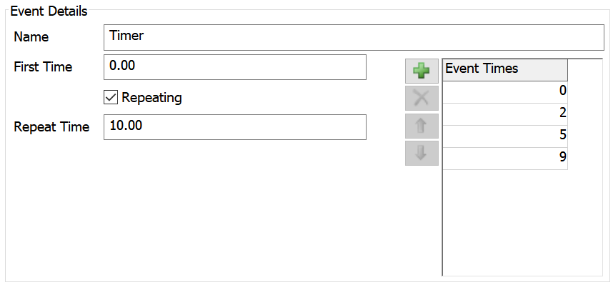
In the example shown in the preceding image, the timer will fire:
- At time 0 (when the model begins)
- At time 2
- At time 5
- At time 9
- Then the schedule repeat itself at time 10, so it will fire at time 10
- Then at time 12
- At time 15
- At time 19
- And so forth...
Non-Repeating Irregular Intervals
To set the timer event to record at specific times and not repeat, set up the schedule using the steps in the previous section but then uncheck the Repeating check box. For example, in the preceding image, the timer would fire at time 0, 2, 5, and 9 and stop firing at that point.