Model Documentation
Overview and Key Concepts
The model documentation chart gives you a blank canvas for creating text, charts and other HTML elements in the dashboard. You can even write FlexScript that will be executed when the chart is drawn.
Properties
The model documentation chart has the following properties:
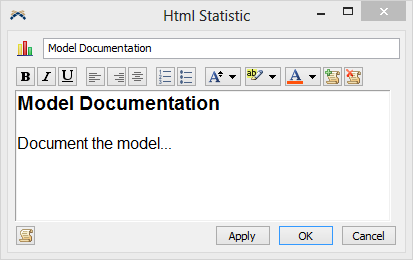
Name Field
This field sets the name of the documentation display chart.
| Icon | Description |
|---|---|
 |
This button makes the selected text bold. If the whole selection is already bold, this button removes the bold effect. |
 |
This button italicizes the selected text. If the whole selection is already italicized, this button removes the italics. |
 |
This button underlines the selected text. If the whole selection is already underlined, this button removes the underline. |
 |
This button makes the text on the current line left justified. If multiple lines are selected, all lines are left justified. |
 |
This button makes the text on the current line right justified. If multiple lines are selected, all lines are right justified. |
 |
This button makes the text on the current line right justified. If multiple lines are selected, all lines are right justified. |
 |
This button places the current line in an ordered list. If multiple lines are selected, all lines are placed in the list. |
 |
This button places the current line in an unordered list. If multiple lines are selected, all lines are placed in the list. |
 |
This button changes the font of the current selection to be the specified size. |
 |
This button highlights the selected text in the specified color. |
 |
This button changes the font color of the selected text to the specified color. |
 |
This button inserts a section of flexscript code, which can be used to dynamically update the model documentation based on the model itself. |
 |
This button removes the current section of flexscript. |
 |
This button toggles the view between the visual editor and the html editor. |