Composite State Bar Template
Overview and Key Concepts
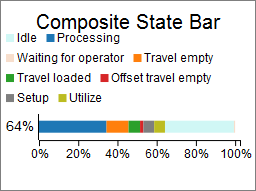
This composite template creates a bar chart, and calculates utilization based on each object's time in various states. Each segment of the bar chart represents the average proportion of time spent in one of the object's states. The utilization shown is the average utilization of all objects.
The Options Tab
The Options tab has the following properties:
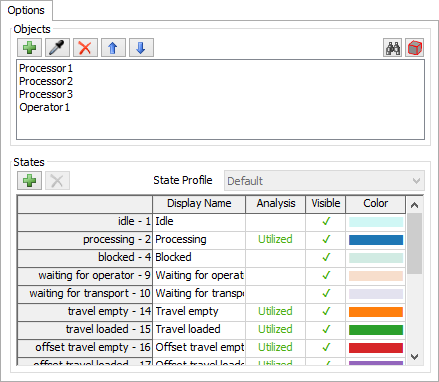
- Objects - Specifies the objects to include on the chart. See Adding Objects for more information.
- States - This property is described in the State Pie Options section. See State Pie Options for more information.
The Settings Tab
The Settings tab is identical to the Bar Settings tab. For more information, see Bar Settings.
The Colors Tab
The Colors tab is identical to the Bar Colors tab. For more information, see Bar Colors.
The Advanced Tab
This template, like all templates, uses the Advanced Tab. For more information, see Advanced Tab.