The Experimenter and Optimizer
Overview and Key Concepts
The Experimenter is a tool that enables you to run the same simulation model multiple times, changing one or more variables each time to see if you get different results. There are a number of different variables that can be tested in your model.
The Optimizer is a tool that will change variables and run scenarios automatically, and search for the best combination of variables for your model.
The Scenarios Tab
The Scenarios tab is where you define the variables and scenarios associated with an experiment. It has the following properties:
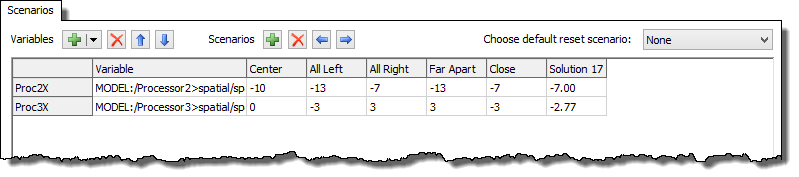
Variables
| Icon | Description |
|---|---|
 |
Add an experiment variable. Select the variable type from the drop down. |
 |
Remove the selected variables. |

 |
Move the selected variables up or down in the list. |
Once variables have been added, you can change them by clicking in the "Variable" cell
for that variable. The 
 buttons will appear. Use these to change the
variable, or type in a path manually.
buttons will appear. Use these to change the
variable, or type in a path manually.
Define the name of the variable in the header column of the table on the left side.
Scenarios
| Icon | Description |
|---|---|
 |
Add a scenario. Once added, enter the value for each variable in that scenario's column in the table. |
|
Remove the selected scenarios. |

 |
Move the selected scenarios left or right in the list. |
You can rename the scenarios by changing the name of the table's column header.
Choose Default Reset Scenario
This allows you to define a scenario for your model to go to when you reset your model outside the experimenter. Once chosen, whenever you reset, the model will go back to that scenario. Choose None if you don't want the model to set its scenario when reset.
The Performance Measures Tab
The Performance Measures tab has the following properties:
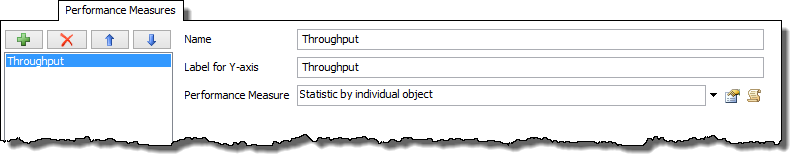
Select a performance measure from the list to edit it. If it is a standard performance measure, controls will display on the right (as seen in the above image). If the performance measure is associated with a dashboard statistic, a Properties button will appear. This will open the dashboard widget's properties window.
| Icon | Description |
|---|---|
|
Add a Performance Measure. If there are dashboards in the model, you can select a statistic from a dashboard as your performance measure. |
|
Remove the selected performance measure. |
|
|
Move the selected performance measure up or down in the list. |
Name
The name of the performance measure will be used in the Performance Measure Results window and can be used in the Optimizer Design tab when defining Constraints and Objectives.
Label for Y Axis
Defines the Y axis title in the Performance Measure Results window.
Performance Measure
This picklist specifies what information will be gathered. Choose from the available picklist options or write your own custom code.
The Experiment Run Tab
The Experiment Run tab is where you define parameters for the experimenter and run it. It has the following properties:
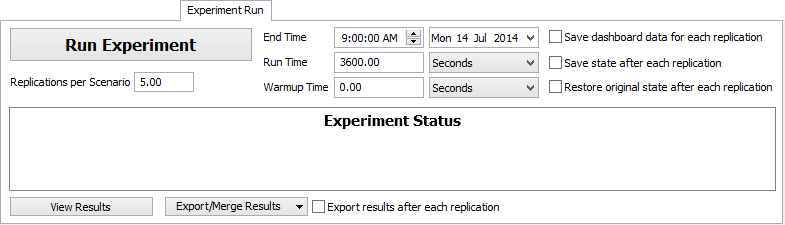
Run Experiment
Starts the experiment run.
Replications Per Scenario
The number of replications that will be run for each scenario.
End Time
The date and time the simulation will end. Based upon the Model Start Date and Time as defined in the Model Settings.
Run Time
The total simulation time that each experiment will run to.
Warmup Time
The simulation time that each replication will run to before resetting their statistics. Statistics will thus only be collected for the time period (Run Time - Warmup Time).
Save Dashboard Data for Each Replication
If checked then at the end of each replication FlexSim will save the data for each dashboard statistic in the model so they can later be viewed as part of the results.
Save State After Each Replication
If checked, each replication's full simulation state will be saved to a file at the end of the replication. This allows you to open the replication in the state where it finished. This can be especially useful if one of your replications fails to give valid results.
Restore Original State After Each Replication
If checked, FlexSim will completely reload the model between execution of each model. You might check this box if your model doesn't properly reset to the same exact state every time you reset, and you don't want that "spill-over" state affecting subsequent replication results. However, because it is completely reloading the tree, it may increase the time it takes to run each replication.
Export results after each replication
Saves results to a file after each replication.
View Results
Opens the Performance Measure Results Window. Click this button once an experiment run has finished.
Export / Merge Results
This button allows you to save your result to a file, as well as load / merge results from a saved file into your current results.
- Export will save the results to a .t file.
- Load will load the results from a saved file into your model, replacing any current results.
- Merge will load results from a file, and then merge those results with your model's current results.
Export results after each replication
Saves results to a file after each replication.
The Optimizer Design Tab
The Optimizer Design tab has the following properties:
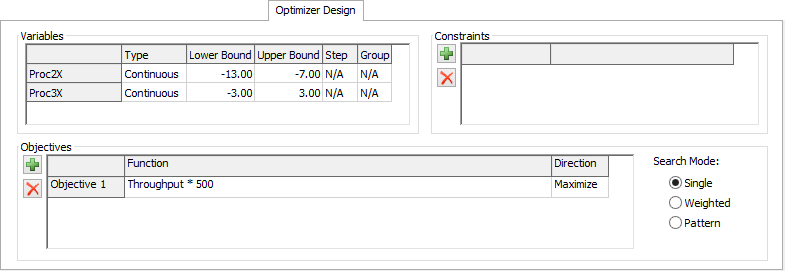
Variables Table
This table displays the variables that are listed in the Scenarios tab. Click in one of
the Type cells to display a  to change a
variable's type. Setting the type will change the cells of the table to reflect which
options are applicable.
to change a
variable's type. Setting the type will change the cells of the table to reflect which
options are applicable.
The following table describes each variable type, and the information needed to use each type:
| Type | Additional Information | Description |
|---|---|---|
| Continuous | Supply an upper and lower bound. The optimizer will generate decimal values ≥ lower bound, and ≤ upper bound for this variable. | Used for a value that can be represented with any decimal value within a range. Durations and postitions are often represented with Continuous variables. |
| Integer | Supply an upper and lower bound. The optimizer will generate integer values ≥ lower bound, and ≤ upper bound for this variable | Used for a countable value. The number of operators or number of machines is often an Integer variable. |
| Discrete | Supply an upper and lower bound, and a step. The Optimizer will generate values equal to the lower bound + n * step, where n = [0, 1, 2, 3, ...]. The value will not exceed the upper bound. The Step should be a positive value, and can be a decimal value. | Used for values that occur on an interval. Part sizes or quantities that can only be adjusted by a fixed amount can be represented by a Discrete variable. |
| Binary | No additional information required. The Optimizer will generate either a 0 or a 1 for this value. | Used for values that have only two possibilities, like "On" or "Off", "Use" or "Don't Use". |
| Design | Same as the Discrete variable type. | Used for values that represent differing options. For example, floor layout 1 vs. floor layout 2, or placement method 1 vs. placement method 2. The Optimizer will not try to infer effects of increasing or decreasing this kind of variable. |
| Permutation | Supply a group number. For each permutation variable in a group, the Optimizer will generate a value [1, n], where n is the number of variables in the group. All variables in the group get a different value. | Used for sequences. Anything that you want the optimizer to re-order, such as a sequence of items to process, can be represented with this variable type. |
| String | Supply a list of possible values for the string. The Optimizer will use one of the given values for this variable. | Used for different text options. Like Design variables, the Optimizer will not try to infer effects of increasing or decreasing this variable type. |
Constraints Table
This table displays all of the constraints for the optimizer. Define an equation using the available variables, boolean and mathematical operators.
| Icon | Description |
|---|---|
|
Add a constraint. |
|
Remove the selected constraint. |
Objectives Table
This table displays all of the objectives for the optimizer. Define a function using the available variables, boolean and mathematical operators.
| Icon | Description |
|---|---|
|
Add an objective. |
|
Remove the selected objective. |
Search Mode
There are three search modes:
- Single - The optimizer will try to maximize or minimize a single objective. The best solution found in the time given will be returned.
- Weighted - The optimizer will try to maximize the cumulative value of all given objectives. Each objective is given a weight and a direction. If a particular objective is to be minimized, its value is multiplied by -1 before it is added to the cumulative objective. The best solution found in the time given will be returned. Selecting weighted will change the objectives table to display the following:
- Pattern - The optimizer will search for solutions that optimize all given objectives. This search mode returns a set of optimal solutions. They are optimal in that for each one, improving any objective worsens the others. For example, a given optimization may maximize profit and minimize cost. For a solution to be optimal, no other solution can exist that increases profit without increasing cost. This is also called "Pareto Optimal."

The Optimizer Run Tab
The Optimizer Run tab has the following properties:
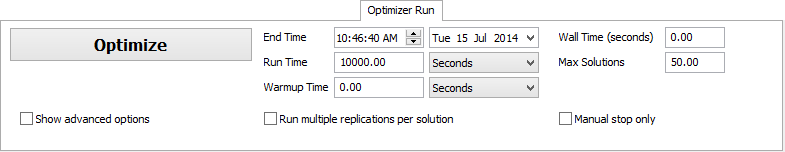
Optimize
Clicking this button begins the optimization process.
End Time
The simulation date and time each solution will end. Based upon the Model Start Date and Time as defined in Model Settings.
Run Time
This is the time in model units that each solution will run.
Warmup Time
The simulation time that each solution will run to before resetting their statistics. Statistics will thus only be collected for the time period (Run Time - Warmup Time).
Wall Time (seconds)
This is the maximum real time the optimizer will spend generating solutions. Once the wall is hit, the active solutions will finish running and then the optimization run will stop.
Max Solutions
The maximum number of solutions the optimizer will generate and test.
Run multiple replications per solution
If checked, the optimizer will run multiple replications for each solution that is generated.
Manual stop only
Sets the optimizer to run until the user stops it.
Advanced Options
Check the Show advanced options checkbox to display additional properties:
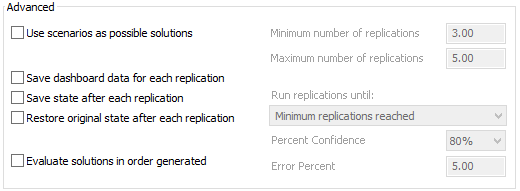
The following advanced properties are available:
- Use scenarios as possible solutions - Use manually-defined scenarios (from the Scenarios page) as initial search points. This gives the optimizer a place to begin it's optimization process and generally shortens the optimization time.
- Save dashboard data for each replication - Check to save data from dashboard statistics at the end of each replication for post-optimization reports/analysis.
- Save state after each replication - Check to save the full state of the model to a file at the end of each replication.
- Restore original state after each replication - Check to restore a clean copy of the model after each replication.
- Evaluate solutions in order generated - Check to ensure solutions are evaluated in the order they are generated. This is slower, but ensures that the optimization search is repeatable.
- Run multiple replications per solution - If
checked, the following options are made available:
- Minimum number of replications - The minimum number of replications that will always be performed for each solution.
- Maximum number of replications - The maximum number of replications that will always be performed for each solution. If set to -1, no maximum will be used.
- Run replications until - Each solution will run replications until the chosen condition is met or the maximum number of replications is reached (if not set to -1).
- Percent confidence - Percent confident that the solution falls within the specified error percent of the mean value of the replications.
- Error percent - Determines the range about the mean for which the percent confidence applies. Must be a value between 0 and 100.
The Optimizer Results Tab
The Optimizer Run tab has the following properties:
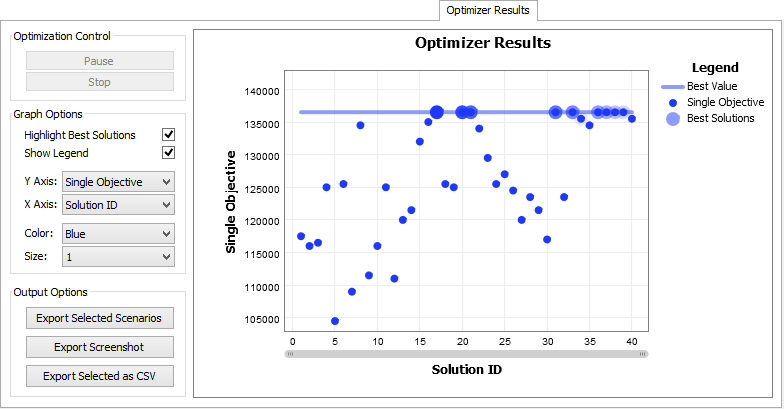
Optimization Control
If the optimizer is currently running through scenarios, you can pause or stop the optimization process.
Graph Options
These options allow you to customize the look of the graph and define what values to plot against the X and Y axes.
Export Selected Scenarios
This option will take the selected scenarios (click on a scenario in the graph to select) and export their data to the scenarios table of the Scenarios tab. This allows you to either run further experiments on the chosen scenarios, or to set your model to one of the selected scenarios by using the Choose default reset scenario.
Export Screenshot
Saves the currently displayed results graph as a PNG file.
Export Selected as CSV
Exports the data from the selected scenarios to a CSV file.
Optimizer Results Graph
Displays the results of the optimizer. If the optimizer is currently running through scenarios, you can pause or stop the optimization process.
The Advanced Tab
The Advanced tab has the following properties:
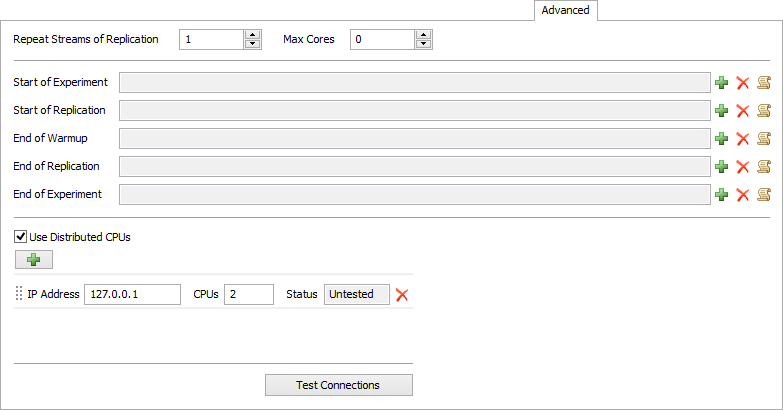
Repeat Streams of Replication
Specify a replication to set the manual model runs (not experimenter replications) to use the same random number streams. You must be repeating random streams for this to take effect.
Max Cores
Specify the maximum number of cores for the experimenter to use. The value 0 indicates that all available cores should be used. This property is ignored if using distributed CPUs.
Use Distributed CPUs
When checked, this property indicates that the Experiment or Optimization should utilize CPUs at the specified IP addresses. This will only work if the servers at the specified IP addresses are running the FlexSim Webserver on port 80. In addition, all servers must have FlexSim installed (licenses are not required for these installations). To run the Experiment or Optimization, use the Run Experiment or Run Optimization buttons as normal.
Distributed CPU List
This list allows you to add, edit, and remove connections to external CPUs. For each entry on the list, you can specify the IP address, and how many CPUs are available at that address.
Test Connections
Clicking this button tests each connection listed. If the connection fails, then there FlexSim was unable to connect with a server on port 80 at the specified address. This does not verify that the remote server is the FlexSim Webserver, or that FlexSim is installed on that server.
The Performance Measure Results Tab
This tab allows you to compare performance measures between the different scenarios. Select the Performance Measure and graph type. The graph types available are: Replications Plot, Frequency Histogram, Correlation Plot, Data Summary, and Raw Data. It has the following properties, which change depending on which graph type is selected:
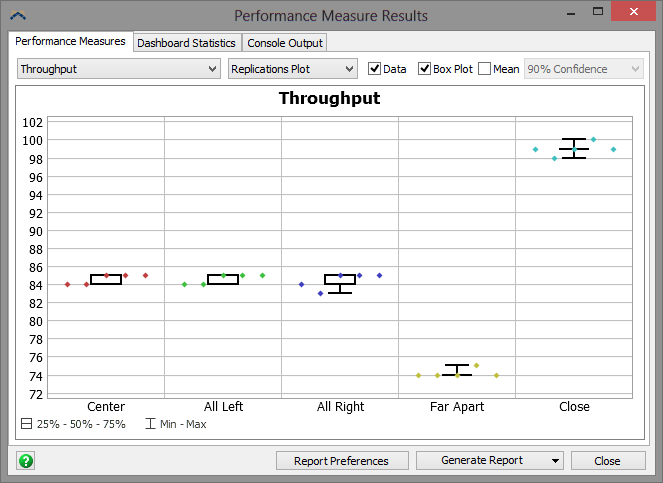
Replications Plot

The Replications Plot graph type has the following properties:
- Data - If checked, the replications plot will plot the data points for all replications.
- Box Plot - If checked, the replications plot will display a box plot.
- Mean - Check the box to display the mean confidence interval for each scenario. You can specify the percentage as 90%, 95% or 99% Confidence.
Frequency Histogram

The Frequency Histogram graph type has the following property:
- Number of Bars - Specifies the size of range to display.
Correlation Plot

The Correlation Plot graph type has the following property:
- Correlate with - Select another performance measure to plot the current performance measure against.
Data Summary

The Data Summary graph type has the following properties:
- Mean Based on - Displays values based on the selected confidence interval.
- Report Preferences - Opens the Performance Measures Report Preferences window. This allows you to prune what data you want included in the report.
- Generate Report - There are two options for
generating reports:
- Report Format - This creates an html file with full results for all performance measures.
- Web Viewer Format - This creates an html file that is interactive. When you open the html file you can choose which graphs you'd like to view.
Dashboard Statistics Tab
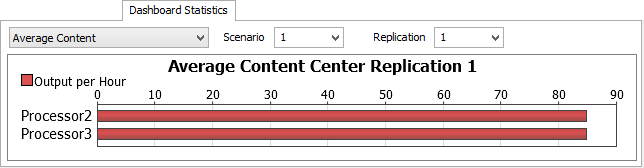
If you have have checked the box Save Dashboard Data for Each Replication in the Experiment Run tab before running the experiment, then you can go to the Dashboard Statistics tab to view individual replication results for various dashboard statistics. Choose the statistic, replication and scenario, and the statistic's associated graph will be shown.
Console Output Tab
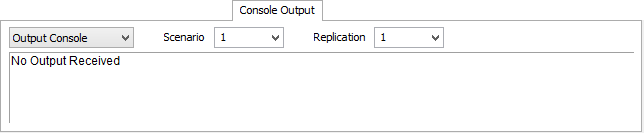
FlexSim also saves the text output of the Output Console and the System Console for each replication. This can be used for debugging/analysis of each replication. Choose Output or System Console and the scenario and replication you want to view.