Tutorial Task 2.7 - Average Content By Type
Task Overview
In this task, you will create a Statistics Collector that records the average content in inventory by type:
This task is based on the same model that was used in the Task 1 of this series. For information on how to open the model, please refer to that task:
Step 1 Add Events to the Statistics Collector
In this step you will add events to the statistics collector. To do this:
- Click on the Toolbox tab on the left of the screen and click the
 button to add a new tool. Navigate to the
Statistics section and select Statistics Collector.
This will open a properties window.
button to add a new tool. Navigate to the
Statistics section and select Statistics Collector.
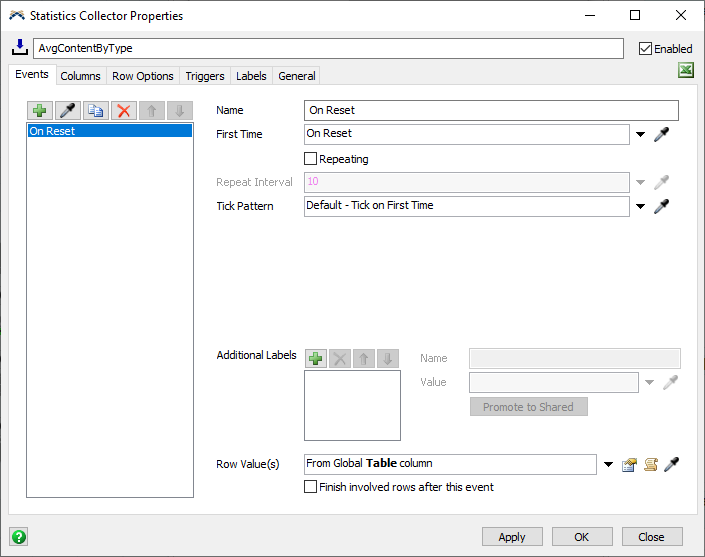
This will open a properties window. - Click on the field at the top and rename the statistics collector to AvgContentByType.
- On the Events tab, click the plus button
and choose
Create an event on reset
- Remove the number from Name of the event, so it reads On Reset.
- Click the triangle button next to the Row Value(s) property and choose From Global Table column.
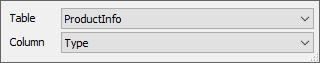
- In the popup, be sure the Table property is set to ProductInfo.
- Set the Column property to Type.
- Click outside the popup to close it.
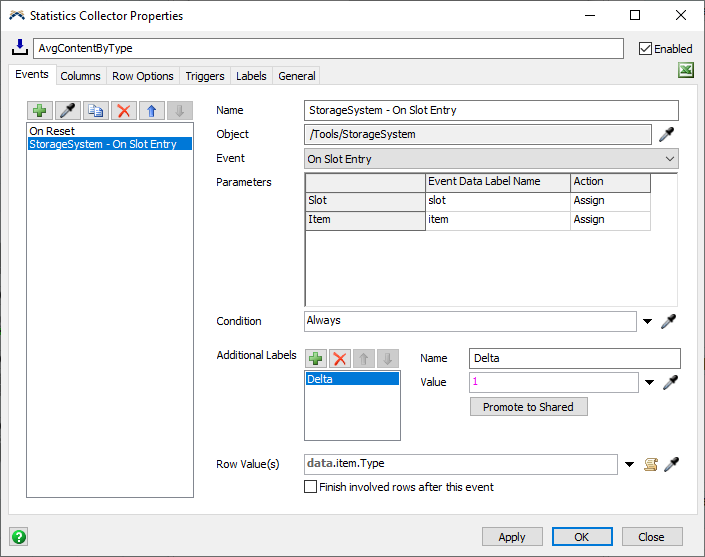
- In the top left of the Events tab,
click the sampler button
 . Then click on the Storage System
in the Toolbox. Choose the On Slot Entry option.
. Then click on the Storage System
in the Toolbox. Choose the On Slot Entry option.
- In the Additional Labels area, click the plus button
, and choose
Add label for this event....
- Set the Name of the label to Delta.
- Set the Value of the label to
1. - In the Row Value(s) field, type the following code:
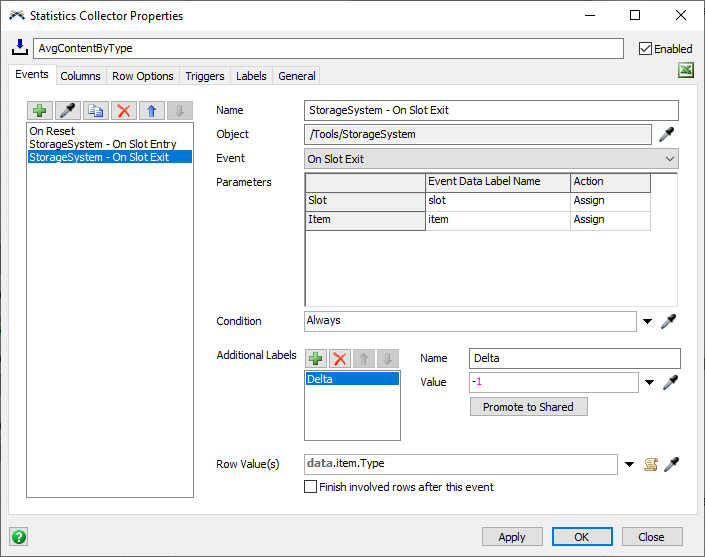
data.item.Type - In the top left of the Events tab,
click on the sampler button
Then click on the Storage System in the Toolbox. Choose the
On Slot Exit option.
- In the Additional Labels area, click the plus button
, and choose
Add label for this event....
- Set the Name of the label to Delta.
- Set the Value of the label to
-1. - In the Row Value(s) field, type the following code:
data.item.Type
Explanation
In this step, you listened to an On Reset event that yields all Type values as its row value. This means that On Reset, the Statistics Collector will add one row per Type. You will later use this event to create one label per row that calculates the average content for each type.
In addition, you listened to the On Slot Entry and On Slot Exit events, which happen as items enter and exit inventory. You will later use these events to update the average content for each type.
Step 2 Add Columns to the Statistics Collector
In this step, you will add columns to the Statistics Collector. To do this:
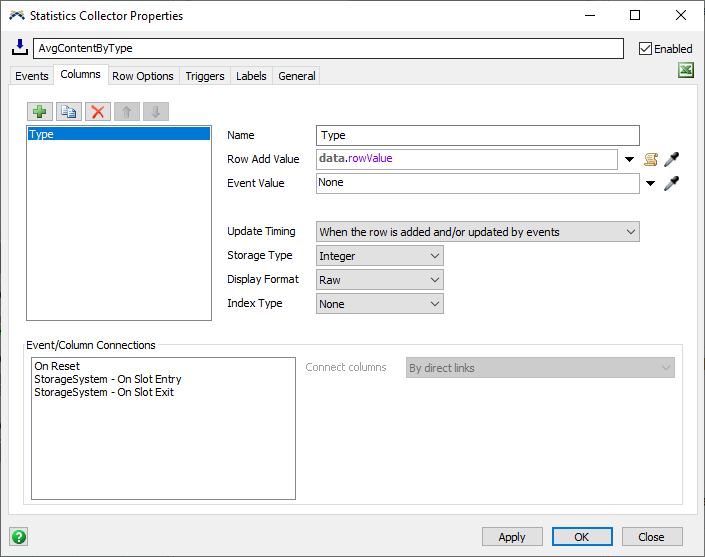
- Click on the Columns tab.
- Click the button once again
and choose Add column.
- In the Name field, rename this column to Type.
- Click the arrow next to the Row Add Value field, point to Data, and choose Row Value.
- Set the Storage Type property to Integer.
- Click the button once again
and choose Add column.
- In the Name field, rename this column to AvgContent.
- Set the Update Timing property to When the value is accessed.
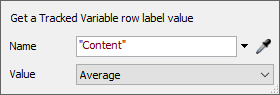
- Click the arrow next to the Value field. Point to Data, and choose Tracked Variable Row Label.
- Set the Name field to
"Content". - Set the Value field to Average.
- Click off of the popup to close it.
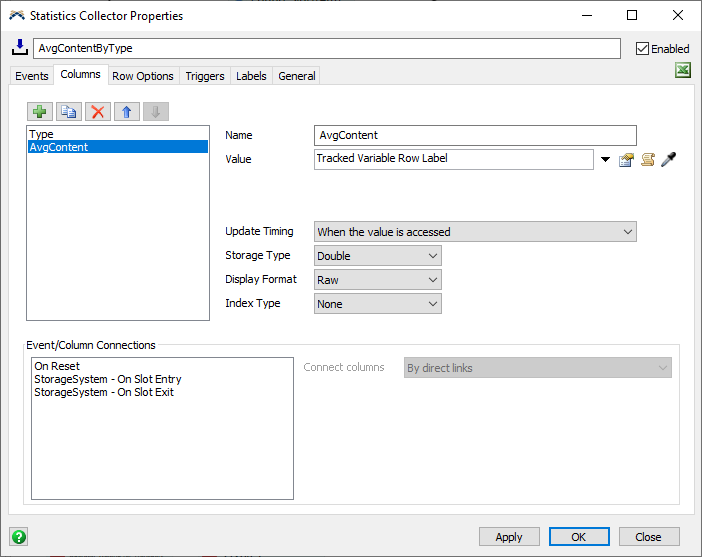
Explanation
In this step, you added two columns: Type and AvgContent. The Type column is straightforward; on reset, when each row is added to the table, this column will record the Type associated with each row. The AvgContent column will show a continuous value, so it updates whenever the table is accessed. In the next step, you will create a Tracked Variable for each row called Content. This column shows the average of that value.
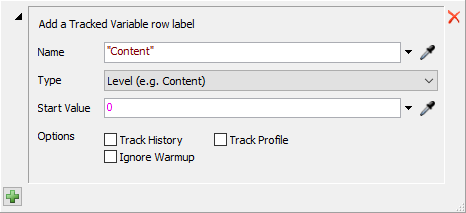
Step 3 Add Triggers to the Statistics Collector
In this step, you will add triggers to the Statistics Collector. To do this:
- Click on the Triggers tab.
- Click the plus button
and choose On Row Adding.
- Click the plus button
in the On Row Adding trigger and choose
Add Tracked Variable Row Label.
- Set the name of the label to
"Content". The other settings can be left at their default values. - Click off of the popup to close it.
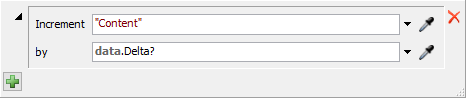
- At the top of the Triggers tab,
Click the plus button
and choose On Row Updating.
- Click the plus button
in the On Row Updating trigger and choose
Increment row label.
- In the popup, set the Increment
field to
"Content". - Set the increment amount to
data.Delta?. - Click off the popup to close it.
- Click the Apply button.
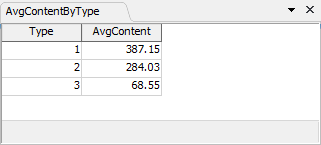
You can right click on the AvgContentByType collector in the Toolbox and select the View Table option. If you reset and run the model, you will see the table record the average content by type. You may wish to run the model as fast as possible to see the data populate.
Explanation
When the model is reset, the statistics collector gets all Type values listed in the ProductInfo table, and creates a row for each one. In addition, the statistics collector initializes a Tracked Variable for each row. A Tracked Variable is a special kind of value; you can get and set it like a normal label value. However, it also calculates the average of the values that you set it to. In this case, that average is time-weighted, which makes it perfect for calculating average content.
When an item enters the Storage System, the statistics collector
creates the data entity and adds two important labels:
- The
itemlabel (an event parameter label) records which item entered. - The
Deltalabel (an additional label) records a value of1.
This event returns the type of the item as the Row Value. This event doesn't update the table directly. However, in the On Row Updating trigger, this event does increment the value of the Content label.
When an item exits the Storage System, the same process happens, except that the Content label is decremented, rather than incremented.
When you view the table, the AvgContent column is updated, displaying the current value of the average content.
Step 4 Creating a Chart
Now you will create a chart to show the data in the statistics collector as a bar chart. To do this:
- Click the Dashboards button at the top of the screen and select the Add a Dashboard option.
- While the dashboard view is active, navigate to the library on the left. Under the Base Chart Types section, find and drag a Bar Chart chart onto the dashboard. This will open the new chart’s properties window.
- Click on the Data Source field and select the AvgContentByType collector from the options.
- Set the Data Format to One bar per row.
- Set the Bar Size to the AvgContent column.
- Set the Bar Color to the Type column.
- In the Split By area, check the Type column box.
- Click on the Settings tab.
- Clear the Show Percentages box.
- Click on the Text tab.
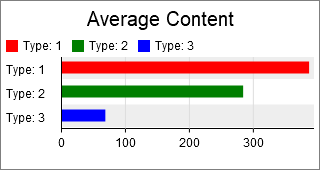
- Check the Custom Title box, and set the custom title to Average Content.
- In the Show Column Headers area, check the box for the Type column.
- Click on the Colors tab.
- Click the Edit Values button, and choose Remove all colors.
- Click the plus button
three times to add three colors.
- Click the Apply Button.
If you reset and run the model now, the bar chart will show the data in the statistics collector. As before you may have to run the model for some time to see the results.