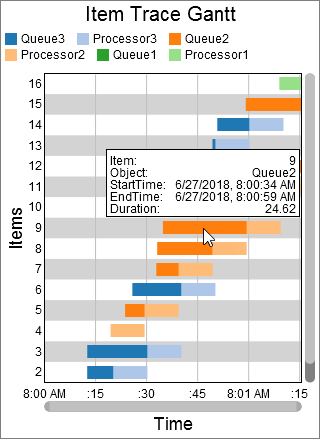
Gantt Chart
Overview and Key Concepts
The Gantt chart allows you to create gantt plots, which are useful for tracking progress over time.

The data for a gantt chart must be laid out in a particular way for the gantt chart to properly draw. That table should look similar to the table shown here:

The Gantt chart draws one colored box for each row. It uses one column to determine which row the box is drawn on. Another column is used to determine the color of the box. The final two columns are used to determine the beginning and end of the box. You can specify the columns that will be used on the Data tab. The order of the columns does not matter.
When you hover over a colored box, a popup will appear, with information related to the specific box:

Performance Measures
The Gantt chart provides performance measures based on the durations. The duration of a given row in the table is the difference between the End Time column and the Start Time column. The chart will provide the Average, Sum, Minimum, or Maximum of all durations as a performance measures. For each unique value in the Value column, the chart will also provide the Average, Sum, Minimum, or Maximum of all durations for that value as a performance measure.
Properties Panels
The Gantt Chart uses the following properties panels: