Key Concepts About Getting Data
Simulation Data Basics
A simulation model generates data as it runs. In FlexSim, some of that data is generated by 3D objects as they interact with flowitems. The following example shows a simple model running, as well as the statistics generated by some of the objects:
In addition to these statistics, you can easily configure your model to collect additional statistics in a table. The following example shows a table that collects the duration from when items enter the queue to when they exit the processor:
FlexSim's statistics system is highly flexsible, so you can use it to get almost any data that you need. Once you have a model generating data, you can:
- View the data within FlexSim
- Create charts based on the data within FlexSim
- Export the data to Excel, a database, or a file
- Export charts as images or html files
- Use the Experimenter or Optimizer to explore different options for your system
Standard FlexSim Statistics
Nearly all 3D objects and process flow activities automatically collect a standard set of statistics while a simulation model runs. In general, these standard statistics are the kind of data that most simulation modelers are typically interested in getting from their model.
For example, most fixed resources collect content statistics that track how many flow items the object currently contains, as well as its minimum, maximum, and average contents, as shown in the following image:
In addition to the standard statistics that are available for each object, you can use chart templates to gather a wide range of other statistics that simulation modelers are typically interested in.
The following table provides an overview of the general categories of standard statistics available on 3D objects and/or process flow activities or through chart templates:
| Category | Explanation |
|---|---|
| Content | Tracks the amount of flow items in 3D objects or the number of tokens in process flow activities. The default statistics can give you the current, minimum, maximum, and average content of a 3D object. |
| State | Lists the current state of a 3D object. For example, a processor has an idle state and a processing state, as well as several other possible states. If you are interested in which states are available for a particular 3D object, you should refer to that object's topic in the Reference section of this manual. |
| Staytime | Tracks the amount of time a flow item stays in a fixed resource. The default statistics can give you the minimum, maximum, and average staytimes. |
| Throughput | Tracks how many flow items or tokens pass through a 3D object or process flow activity. The default statistics can give you the object or activity's current input and output. |
| Travel | Tracks the total distance a task executer travels, measured in the simulation distance units you used when you first set up your simulation model. |
In addition to these general categories, some 3D objects or process flow activities collect additional standard statistics that are specific to their functionality.
Standard Data Gathering Methods
The following image provides an overview of the major phases of the data gathering process for the majority of simulation projects:
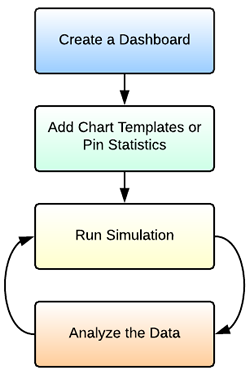
The following sections will explain each phase of the process and link to other relevant topics for more information.
Create a Dashboard
The first step in getting data from your model will be to add a dashboard to your simulation model. Dashboards are a blank window pane that you can customize with anything that you need to access during a simulation run. You will need a dashboard in order to use chart templates or to pin the specific object statistics you're interested in. See Key Concepts About Dashboards and Charts for more information.
Add Chart Templates or Pin Statistics
The next step is to choose a chart template that is appropriate for the kind of statistics you're interested in getting from your simulation model. You could also pin any of the standard statistics available for any 3D object or process flow activity using the statistics panel in Quick Properties.
When you add a chart template or pin an object statistic to the dashboard, FlexSim will create the necessary background tools (statistics collectors, calculated tables, etc.) that will gather data about the statistic you're interested in. If you're using a chart template, a properties window will pop up that will allow you to select which object(s) you want to gather statistics from. See Overview of Chart Templates and Viewing Standard Statistics for more information.
Run the Simulation
While the simulation runs, you can:
- Watch any charts update in real time in the dashboard.
- Watch the standard statistics update in real time in Quick Properties or statistics windows. You could also watch it in the dashboard if you pin it to the dashboard.
See Running a Simulation for more information.
Analyze the Data
After the simulation run, you can study the data outputs and make changes to the simulation model as needed. You can also export the data for analysis by a third party tool. You can also use some of the more advanced data gathering tools if you feel they will be relevant to your simulation project. See the next section for more information.
Advanced Data Gathering Methods
If your simulation model has advanced data gathering needs, you should consider learning more about how the statistics collector and other tools work. See Overview of Advanced Data Gathering Methods for more information.
The following table provides an overview of the advanced data gathering tools:
| Tool | Description |
|---|---|
| The Statistics Collector | Statistics collectors can gather raw data from the objects and events you specify during a simulation run. During a simulation run, collectors will listen to these objects and put the raw data into a data table. |
| The Calculated Table | Calculated tables can transform the raw data from the data table that was generated by a statistics collector. Calculated tables can transform this data in a variety of ways, including filtering statistics, comparing statistics, and performing advanced calculations. |
| The Experimenter | The Experimenter is a tool that runs the same simulation model multiple times, changing one or more variables each time to see if the results are different. |
| The Optimizer | Depending on your license type, the Experimenter can also include the Optimizer, which can give you a high-level overview of the conditions that will produce the best possible solution for the problem you are trying to solve through simulation. |