Working With Charts
Key Concepts and Overview
FlexSim's charts display output table data. Both the Statistics Collector and the Calculated Table create an output table that can be visualized with a chart.
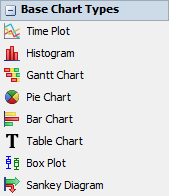
FlexSim provides the following chart types, found in the Base Chart Types section of the Dashboard Library:
Each chart type visualizes data from a table. In fact, each chart type visualizes data from specific columns in a table. For example, a time plot visualizes data from two columns a column for the x values, and a column for the y values. In the following image, you can see:
- A table
- A time plot's properties window, and
- A time plot, visualizing the table data.
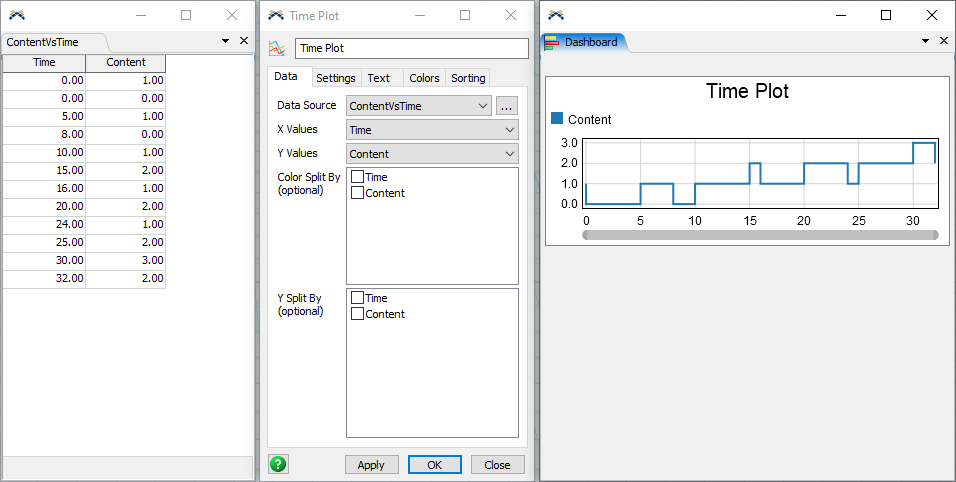
In this example, there is a table called ContentVsTime. The time plot is configured to visualize this table, showing the Time column along the x axis, and showing the Content column along the y axis.
To make a custom chart in FlexSim, you can use the following steps:
- Deterime which kind of chart you would like.
- Use the Statistics Collector or Calculated Table to create a table of data. Be sure that the table you have created is compatible with the type of chart you want.
- Create a chart, from the Base Chart Types section of the library.
- Configure the chart by selecting the table to visualize, as well as which columns in that table contain the values to visualize.
Using Split-by Columns
Many of the charts have Split by properties. This means that you can designate one or more columns that contain categorizing values for each row.
For example, a time plot can use additional columns to determine which y-axis to plot values in:
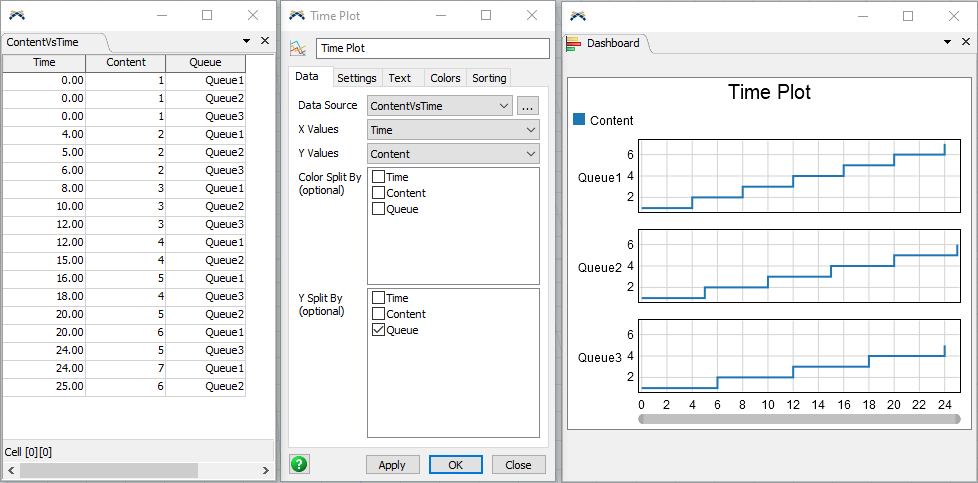
In this example, the time plot is using the Queue column to categorize each data point. All data points that have a matching value in the Queue column are plotted together.
The time plot, histogram, box plot, bar chart, and pie chart all allow you to use a split by to group values along an axis. The time plot, histogram, and box plot also allow you to use a split by to group values by color.
Sorting Categories
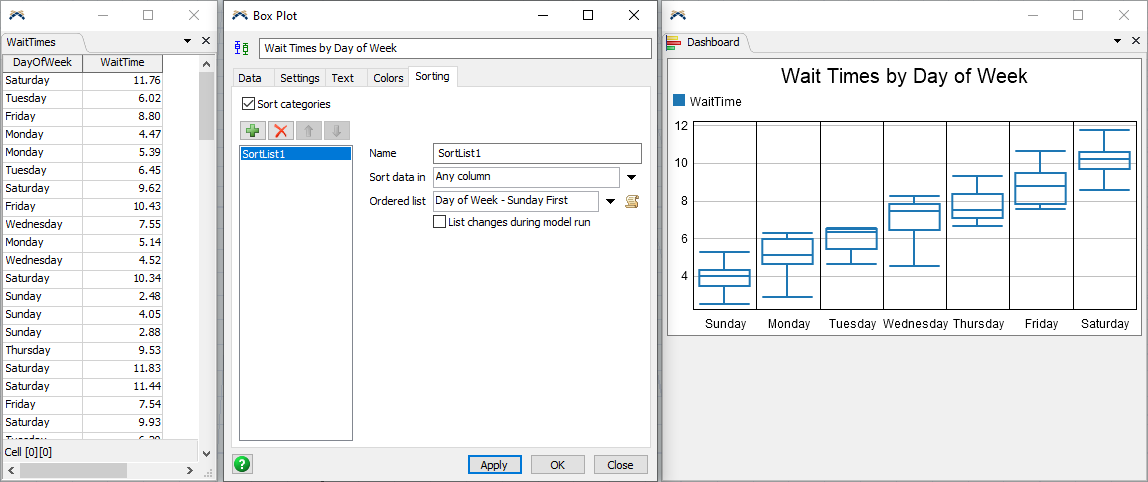
Each chart will categorize its data, often by using a split-by. By default, these categories are ordered on the chart as they are in the table. For example, the box plot below has data categorized by day of week:
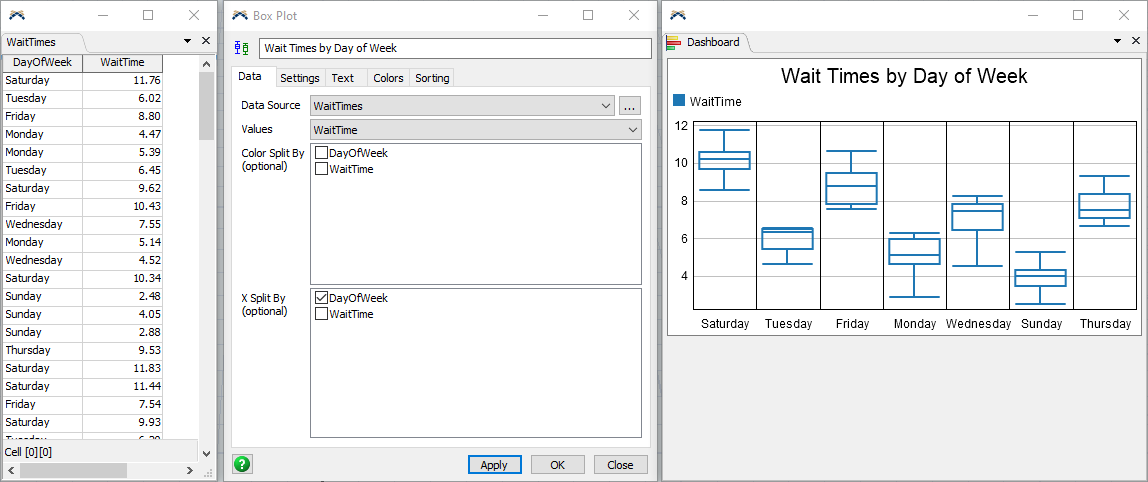
You can see that the order of the days of the week shown in the chart matches the order they are found in the table, as you read down the table.
You can change this behavior by sorting the categories on the chart. Charts that allow you to sort the category values have a Sorting tab:
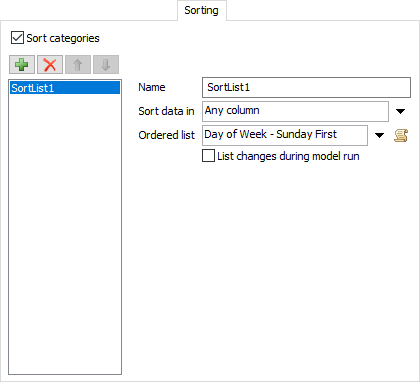
On each chart, you must opt-in to sorting by checking the Sort categories box. When you do that, you will see a list of sort elements.
When you add a sort element, you will have two options:
- Sort by ordered list
- Sort in alpha/numeric order
If you sort using an ordered list, you will need to supply an array of values, in the order you would like them to appear on the chart. For example, you could provide a list of the names of the days of the week:
["Sunday", "Monday", "Tuesday", "Wednesday", "Thursday", "Friday", "Saturday"]
In this case, the chart will understand that "Monday" comes after "Sunday" and before "Tuesday".
When you provide a list, be sure that the list contains all possible values for that category. Any missing values will be sorted to the end of the list.
If you sort in alpha/numeric order, the chart will compare values directly. You can specify whether to sort in ascending or descending order. Text values are sorted alphabetically, and number values are sorted by their value.
Going back to the previous example, if you choose to sort using an ordered list, you can sort the x-axis categories in a meaningful way: