The State Table
Overview and Key Concepts
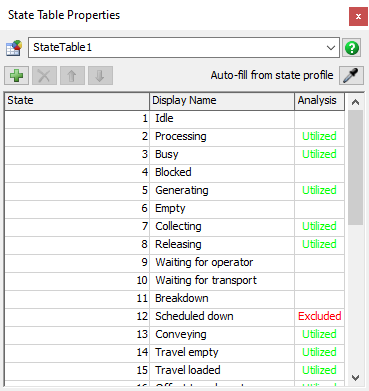
The State Table is a table listing state values, their corresponding display names, and how their utilization should be calculated. There is no limit to how many states can be added, and the table can be auto-filled from object state profiles. Its primary purpose is to be read by state chart templates to determine what they should show.
The State Table can be accessed from the Toolbox. A model can have any number of State Tables.
General Use
The State Table is a table, similar to a Global Table; it is a table that is accessible in the toolbox, and you can write custom values in that table. However, Global Tables are generally used to store input data, or data that the model uses to determine its behavior. State Tables, on the other hand, can only be manipulated through the property window and are read from to determine what should be shown on state chart templates.
Column Values
This section describes the values of the 3 columns.
State
This is the state value and can either be numeric or string.
Display Name
The display name is what will be shown on the chart.
Analysis
This determines how the utilization of the state will be calculated. It has 3 options: non utilized (empty cell), utilized, and excluded. Clicking the cell will cycle through the 3 options.
Adding States
This section describes how to add states.
| Icon | Description |
|---|---|
 |
Add a blank state. |
 |
Removes the selected state row(s). |
 |
Moves the selected state row(s) up. |
 |
Moves the selected state row(s) down. |
Auto-fill
 Use the sampler to select an object's state profile to
auto-fill the table with. When the sampler is hovering
over an object with multiple state profiles, a list of available
state profiles will appear.
Use the sampler to select an object's state profile to
auto-fill the table with. When the sampler is hovering
over an object with multiple state profiles, a list of available
state profiles will appear.