Running Experiments
About the Experimenter and Optimizer
The Experimenter is a tool that runs the same simulation model multiple times, changing one or more parameters each time to see if the results are different. The Experimenter also includes the Optimizer, which can search for the conditions that will produce the best possible solution for the problem you are trying to solve through simulation.
Please read Key Concepts About Experiments before reading the rest of this topic.
Opening the Experimenter and Optimizer
To open the Experimenter and Optimizer:
- On FlexSim's main menu, click the Statistics menu.
- Select Experimenter.
Once you've created an Experimenter, you can access it by double-clicking the Experimenter from the Toolbox.
Overview of the Experimenter/Optimizer User Interface
The Experimenter/Optimizer looks like a window that has multiple tabs. The tabs are organized in the order that you would use them to set up and run the Experimenter and Optimizer. You should start with the left-most tab (Scenarios) and change the necessary settings. Then, you should click the tab to its right and change those settings and so forth.
The following table explains the basic purpose of each tab:
| Tab | Purpose |
|---|---|
| Scenarios | You can use the table on the Scenarios tab to set up the basic conditions of your experiment. You'll use this tab to specify which parameters you will test and the value of each parameter in each scenario of your experiment. |
| Experiment Run | You will use this tab to run the actual experiment and monitor its progress until it is complete. You can also use this tab to determine how many replications you will run for each scenario. This tab can also control the data you will collect and export after the experiment is finished. |
| Optimizer Design | On this tab, you'll set up the constraints and objectives for the Optimizer run. You can also determine whether you want a range of solutions (recommended), a single solution, or a weighted solution. |
| Optimizer Run | You'll use this tab to run the Optimizer and monitor its progress until it is complete. If you didn't specify an end time, you'll also use this tab to stop an optimization run. |
| Optimizer Results | This tab displays the results of the optimization and its recommended solutions. You can also use this tab to export the data it collected. |
| Advanced | The Advanced tab has many different triggers that you can use to change aspects of the simulation model when an experiment or replication starts or ends. This tab is useful if you want something specific to happen in the simulation model that you can't change until the actual model begins to run. |
Designing Scenarios and Testing Parameters
To design the scenarios and test the Parameters in your experiment, you will use the Scenarios tab in the Experimenter, which is shown in the following image:
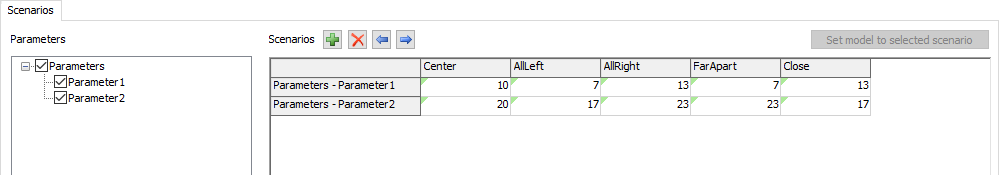
The Scenarios tab is a table where each row represents a parameter that you will test and each column represents a different scenario. (See Key Terms for more information about these terms.) You can add or remove scenario columns using the Add and Remove buttons as needed. You can add or remove parameters by checking the box associated with that parameter in the Parameters area.
By editing the table, you can change the parameter values for each scenario. You can also change the name of the scenario by editing the column header for that scenario.
Adding and Changing Parameters
To determine which parameter will change in each scenario, check the box for that parameter in the Parameters section. Note that the parameters are organized by Model Parameter Table. If you check the box for a table, all parameters in that table will be added to the experiment. You can expand or collapse the list for each parameter table, for convenience. Whether a table is expanded or collapsed has no effect on the experiment.
Adding and Changing Scenarios
Now that you have specified which parameter you want to test, you will use the Scenario columns to indicate how each parameter will be different in each scenario. To change the parameter in each scenario:
- Click a cell listed under the Scenario column.
- Type the value you want the parameter to have when this scenario runs.
For example, imagine that you want to find the ideal number of operators your model will need in order to reduce processing times. You would create a Scenario column for each operator. In the first Scenario column, you would type the number 1. That means that you would test how your simulation model runs with only one operator. In the second Scenario column, you would type 2 to test the model with two operators, and so forth.
Defining the Experiment's Goals
The Experiment will automatically collect all Performance Measures in the model. Note that you'll need at least one Performance Measure to run an experiment.
Running an Experiment
To run your experiment, you will use the Experiment Run tab in the Experimenter, as shown in the following image:
The following sections will explain the various stages of running an experiment.
Before Running an Experiment
You should strongly consider checking the Restore original state after replication checkbox on the Experiment Run tab before running experiments. This checkbox will ensure that each replication starts from the same starting state on reset and will help ensure accuracy.
The following checklist covers a few things you might want to consider doing on the Experiment Run tab before you run the experiment:
- Change the number of replications - You can change the Replications per Scenario setting to determine how many replications you should run. By default, the Experimenter will run three replications. But you can increase or decrease that number if needed.
- Edit the End Time and Run Time settings - You need to define a specific point in time that the simulation model will finish running. Remember that you'll want to run the simulation model long enough to collect data that will be representative of your business system over time. You can either set the end time using the End Time setting or Run Time settings. Both settings are connected: when you edit one setting the other setting will automatically update.
- Add a Warmup Time if needed - A warmup time is the amount of time it will take the model to reach a steady state or to get to its normal operating capacity. After the model warmup time, the simulation model will reset the statistics it's collecting.
- Save output data if needed - You can check the checkboxes that allow you to save Dashboard data or states for each replication if you want to export the results for each replication. You might also want to ensure that your Dashboard is set up to track the correct information before you run your experiment.
Running an Experiment
Click the Run Experiment button to begin the experiment. After a moment, the Experiment Status progress bars will appear in the middle of the Experiment Run tab.
Each scenario will have a progress bar divided into sections for each replication that you are running. As you watch, the red bar will gradually turn green, indicating the progress of the simulation run. When all the bars are green, the experiment is finished.
If you would like to run the experiment again, click the Reset Experiment button to erase the Experiment Status progress bars. Click the Run Experiment button to repeat the experiment.
After Running an Experiment
When you're done running the experiment, click the View Results button to open a separate window with the results. The Experiment Results window has three tabs:
| Tab | Purpose |
|---|---|
| Performance Measures | This tab will display the results of the experiment for each performance measure that you defined. Use the menu to select the specific performance measure you want to display. |
| Dashboard Statistics | This tab will display dashboard charts from any of the scenarios and replications you are interested in exploring. Be aware that you need to first add the charts you are interested in to your Dashboard in your simulation model before you can use this tab. |
| Console Output | Use this tab to check that there weren't any errors in your simulation models when you ran the experiment. This tab will allow you to check the console output for each replication for any console error messages. Make sure you don't skip looking at this step. |
The following image shows an example of the experiment results for one set of experiments:
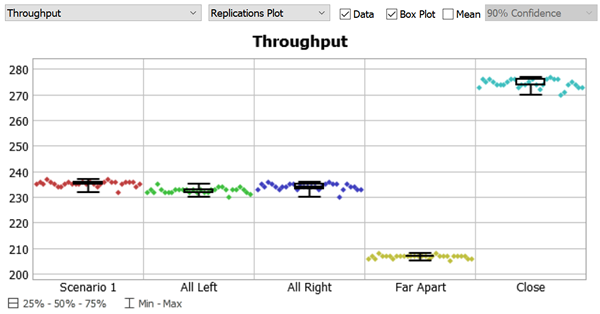
In this case, the experiment shows that placing processors closer together dramatically increases the system's throughput.
The following image shows an example of the Dashboard Statistics for one replication in the Experimenter:
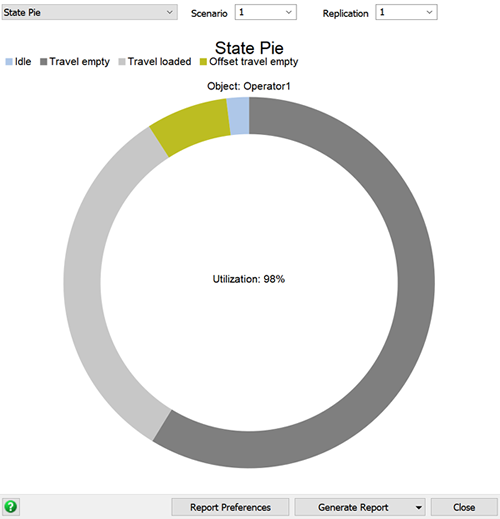
You can view any chart for any replication as needed.
Designing an Optimization
You'll use the Optimizer Design tab to set up an optimization, as shown in the following image:

Optimization Parameters
The Optimizer will use the parameters specified on the Scenarios tab. The Optimizer uses the type information about each parameter to understand what kinds of values are valid for that parameter. For example, the optimizer won't try a value higher than the upper bound of a given parameter.
Adding Objectives
You need to define what success looks like so that the Optimizer can determine which solutions best meet that definition. You'll do this by adding your specific goals to the Objectives table in the Optimizer Design tab.
Be aware that you have to express the objectives in terms of a simple equation. For
example, if the items produced by the system can be sold for $300.00, you could calculate
revenue as: [Throughput * 300].
These equations can include references to parameters that are included in the Experimenter, as well as any Performance Measure. For example, if you created a variable on the Scenarios tab.
For example, imagine you wanted to calculate the cost to produce items. Imagine that
wages for the workers equaled $1000 per worker and the materials needed to produce an item
cost $10. You could use the following expression as your objective: [TeamSize] * 1000
+ [Throughput] * 10.
One thing to be aware of is that the third-party software that runs the Optimizer isn't designed to read FlexScript expressions as objectives. Fortunately, you can use FlexScript expressions when defining parameters and performance measures in the Experimenter. So you can incorporate your own custom code using those indirect methods.
Note that each objective has an Active field. Only the active objectives are included in an optimization. If more than one objective is active, the Optimizer will perform a multi-objective search. If only one objective is activy, the Optimizer will perform a single-objective search. You need at least one active objective to run the Optimizer.
Adding Constraints
Constraints are a way of specifying additional conditions that a given model must maintain. The Optimizer will only mark a configuration as optimal if it is feasible within the constraints you've defined.
Constraints are very different from objectives. An objective is a scoring function; the optimizer is trying to find parameters that improve the scores. A constraint is a pass-fail test. The optimizer will evaluate whether a given solution passes all the tests. If it does, then the solution is considered feasible. If the solution fails any of the tests, the the optimizer considers that solution as infeasible. The optimizer will try to find the best feasible solution.
Constraints are expressions that involve a ≤ or a ≥ comparison. Here are some example constraint equations:
[OnTimeJobsPercent] >= 0.80[ReworkParts] <= 10[Utilization] >= 0.75[PackTeamSize + ShipTeamSize] <= 30
In some cases, a constraint is there to enforce performance standards while optimizing. The optimizer is very focused, and without a constraint, may give you an unhelpful answer. For example, if you have an objective to maximize throughput, the optimizer might increase the number of employees to an absurdly high number. Throughput is fantastic, but maybe utilization is unacceptably low. To avoid this issue, you could add a constraint, so that utilization must be kept at or above a certain threshold. Constraints that involve performance measures are evaluated after the replication has been run.
In other cases, a constraint is there to enforce rules between multiple parameters. For example, the optimizer might be allowed to increase the number of people on various teams. However, you might want to keep the total number of people below 30. So you could add a constraint that specifies the sum of several parameters is less than some number. A constraint that only involves constants or parameter values can be evaluated without actually running the replication. They just help the optimizer suggest valid solutions.
Running an Optimization
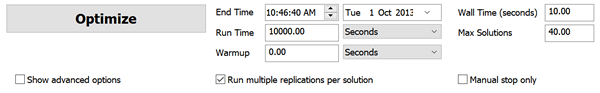
To run an optimization, you will use the Optimizer Run tab in the Experimenter, as shown in the following image:
The following sections will explain the various stages of running an optimization.
Before Running an Optimization
The following checklist covers a few things you might want to consider doing on the Experiment Run tab before you run the experiment:
- Update the End Time, Run Time, and Warmup settings if needed - The End Time and Run Time settings will automatically use the same settings that you used on the Experiment Run tab. If you edit them here, it will also change those settings on the Experiment Run tab as well. If you want the Optimizer to ignore these setting so that you can manually stop it, you could check the Manual stop only button.
- Determine stop conditions - By default, the optimizer stops when all solutions have been evaluated. However, the number of possible solutions to consider, combined with the time it takes to consider a single solution, makes evaluating all possible solutions impossible. You can specify a maximum number of solutions to try; the optimizer will stop once it has run that many solutions. You can also specify a wall time. This is the number of real seconds that the optimizer is allowed to run. The optimizer will stop if it has been running for longer than that amount of time. If you specify both values, the optimizer will run until one of these conditions is met. If you specify neither (using a zero in both fields), then the optimizer will run until you press the Stop button.
Running an Optimization
Click the Optimize button to begin running the Optimizer. After you press this button, the window will automatically switch to the Optimizer Results tab where the results will begin displaying real time.
Analyzing Optimizer Results
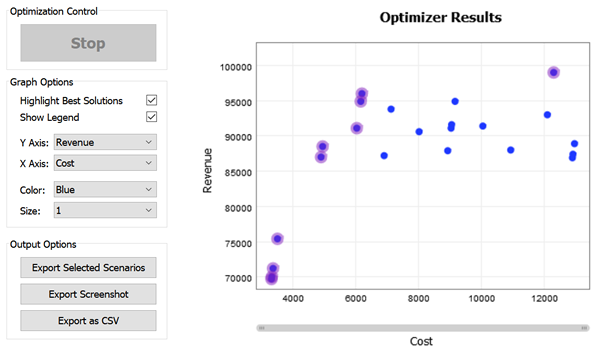
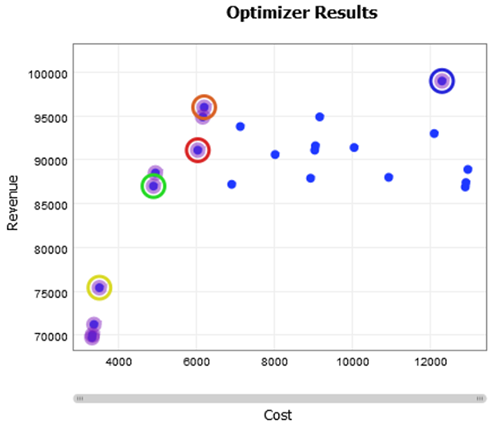
Once you've gotten the Optimizer's recommended solutions, you can explore which scenarios and variable settings were able to generate those solutions. You'll mostly use the Optimizer Results tab to analyze the results, as shown in the following image:
The following sections explain different ways you can analyze the Optimizer's results.
Selecting Solutions
First, you need to select the solutions you are most interested in exploring. To select a solution to explore:
- Point to a solution in the Optimizer Results graph. As you hover over it, you'll notice a light gray ring will appear around it.
- Click the solution to select it. The selected solution will then display a colored circle around it to indicate that it is selected.
- Click additional solutions as needed. Each solution will automatically be assigned a unique color, as shown in the following example:
Viewing Inputs and Outputs for Selected Solutions
Once you've selected the solutions you're interested in, you can use the controls in the Graph Options group to change which results are displayed in the Optimizer Results graph. These controls can affect which data inputs and outputs you can view.
As you change the graph options, you can see where the solutions you selected now fall on the graph, as shown in the following image:
Be aware that you can point to a specific solution with your mouse to see pop-up text that will describe the exact Y- and X-axis statistics for that solution.
Exporting Selected Scenarios
You can export selected scenarios from the Optimizer to the Experimenter if needed. You can export the scenarios by clicking the Export Selected Scenarios button. When you click this button, the window will immediately switch back to the Scenarios tab. The scenarios you selected will be appended as new columns at the end of the Scenarios table. Be aware that you might have to scroll to the right in order to see the Scenarios you selected in the table.
There are a few reasons why it might be helpful to export to the Experimenter:
- See the parameter settings for selected solutions. If needed, you can export the selected scenarios to the Scenarios tab so that you can view their exact settings for each of the parameters. Be aware that you can also view the settings by changing the settings in the Graph Options group too.
- Run more replications of the selected solutions. To ensure that your statistical averages for a given solution are valid, you might want to run some additional experiments on those solutions, increasing the number of replications you run.
- Choose a specific scenario and watch the 3D model for it run in real time. You might want to see a model run of one of the solutions in real time. You'd need to export the solution to the Experimenter first in order to do this.
To run a specific scenario in real time:
- On the Optimizer Results tab, click the solution(s) you want to see in real time.
- Click the Export Selected Scenarios button. The window will automatically switch to the Scenarios tab.
- Click the Choose default reset scenario menu to open it. Select the scenario that you'd like to run in the 3D model.
- On the simulation control bar, press the Reset button to change the model to that scenario. Then press the Run button and watch the model as normal.
Exporting Screenshots
You can export an image file in .png format of the Optimizer Results graph as needed:
- Check the Graph Options settings to ensure that you have selected the correct graph display settings.
- Click the Export Screenshot button.
- Navigate to the folder location where you want to store the image file.
- Type a name for the file and click the Save button.
Exporting .CSV Files
You can export a spreadsheet in the .csv file format as needed. Be aware that the Optimizer will export the data from the full Optimizer results, not just selected solutions.
To export a spreadsheet of the results:
- Click the Export as CSV button.
- Navigate to the folder location where you want to store the file.
- Type a name for the file and click the Save button.
Querying Statistic Collector Results
If you set up a Statistics Collector to gather custom statistics from your 3D model, the Statistics Collector will run in the background for all replications in any experiments or optimizations. At this point, you need to create a Calculated Table in order to view the raw data from these experiments.
If you are comfortable writing SQL queries, you can import the raw data from these
experiments using the Experiment.MyStatisticsCollector keyword. See
SQL
Queries for more information. If you are not comfortable with SQL Queries, you can
contact FlexSim
Customer Support for assistance.