The Experimenter and Optimizer
Overview and Key Concepts
The Experimenter is a tool that enables you to run the same simulation model multiple times, changing one or more parameters each time to see its effect on the performance measures.
The Optimizer is a tool that will change parameters and run scenarios automatically, and search for the best combination of variables for your model.
Both tools require you to create parameters and performance measures in your model. For more information, see the Model Parameters and Performance Measures topics.
Once you have created parameters and performance measures, you are ready to use the experimenter and optimizer. To use the experimenter, you'll specify a set of scenarios, or combinations of parameter values that you want to try. You'll also specify how many replications of each scenario you'd like to run. When you run an experiment, all replications of all scenarios will be simulated and run in background FlexSim processes, and you'll be able to review the results.
To use the optimizer, you'll need to define one or more objectives. An objective is an equation, usually related to performance measures, that can be used to score the model. You can also indicate whether the optimizer should maximize or minimize the objective. When you run an optimization, the OptQuest engine will try various combinations of parameter values in order to improve the score of each objective. Like the experimenter, the optimizer will run simulations in background FlexSim processes. You'll be able the view the results of the optimization, as well as the results of each scenario attempted by the optimizer.
The Scenarios Tab
The Scenarios tab is where you define the variables and scenarios associated with an experiment. It has the following properties:
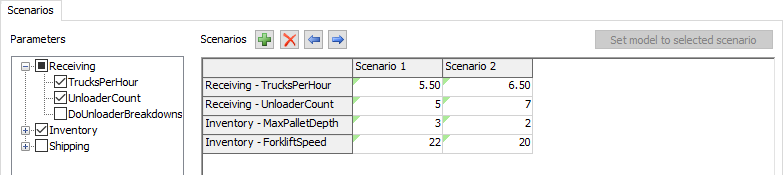
Parameters
The parameters section allows you to specify which parameters will be included in the next experiment or optimization. To include a parameter, you can check the box for that parameter. Alternatively, you can include all parameters from a given Model Parameter Table by checking the box for that table.
Scenarios
| Icon | Description |
|---|---|
 |
Add a scenario. Once added, enter the value for each variable in that scenario's column in the table. |
 |
Remove the selected scenarios. |

 |
Move the selected scenarios left or right in the list. |
You can set the parameter values for each scenario by editing this table. Each cell in the table has the same constraints as its corresponding parameter. If you change parameter name, ordering, type, or constraints in the model, you will need to re-open this view. You can rename the scenarios by changing the name of the table's column header.
Set model to selected scenario
This button becomes available when you have selected a column in the table. When you click this button, the parameters in the model are set to the values in that column.
The Experiment Run Tab
The Experiment Run tab is where you define parameters for the experimenter and run it. It has the following properties:
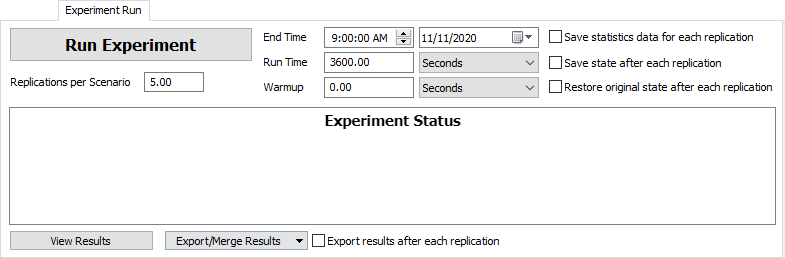
Run Experiment
Starts the experiment run.
Replications Per Scenario
The number of replications that will be run for each scenario.
End Time
The date and time the simulation will end. Based upon the Model Start Date and Time as defined in the Model Settings.
Run Time
The total simulation time that each experiment will run to.
Warmup Time
The simulation time that each replication will run to before resetting their statistics. Statistics will thus only be collected for the time period (Run Time - Warmup Time).
Save Statistics Data for Each Replication
If checked then at the end of each replication FlexSim will save the data for each dashboard statistic in the model so they can later be viewed as part of the results.
Save State After Each Replication
If checked, each replication's full simulation state will be saved to a file at the end of the replication. This allows you to open the replication in the state where it finished. This can be especially useful if one of your replications fails to give valid results.
Restore Original State After Each Replication
If checked, FlexSim will completely reload the model between execution of each model. You might check this box if your model doesn't properly reset to the same exact state every time you reset, and you don't want that "spill-over" state affecting subsequent replication results. However, because it is completely reloading the tree, it may increase the time it takes to run each replication.
Export results after each replication
Saves results to a file after each replication.
View Results
Opens the Performance Measure Results Window. Click this button once an experiment run has finished.
Export / Merge Results
This button allows you to save your result to a file, as well as load / merge results from a saved file into your current results.
- Export will save the results to a .t file.
- Load will load the results from a saved file into your model, replacing any current results.
- Merge will load results from a file, and then merge those results with your model's current results.
Export results after each replication
Saves results to a file after each replication.
The Optimizer Design Tab
The Optimizer Design tab has the following properties:
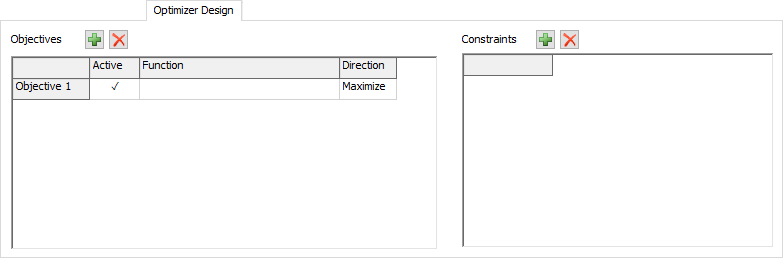
Objectives Table
This table displays all of the objectives for the optimizer. Define a function using the available parameters, performance measures, boolean and mathematical operators. If the Active cell is checked, then that objective will be used in the next optimization. At least one objective must be active. The optimization will pursue all objectives. If more than one objective is active, the optimizer will seek to determine the best trade-offs, and present those as optimal solutions.
| Icon | Description |
|---|---|
|
Add an objective. |
|
Remove the selected objective. |
Constraints Table
This table displays all of the constraints for the optimizer. Constraint equations should use ≤ and ≥ for comparisons. Assuming you had a performance measure named Throughput, you could write the following constraint:
[Throughput] >= 500| Icon | Description |
|---|---|
|
Add a constraint. |
|
Remove the selected constraint. |
The Optimizer Run Tab
The Optimizer Run tab has the following properties:
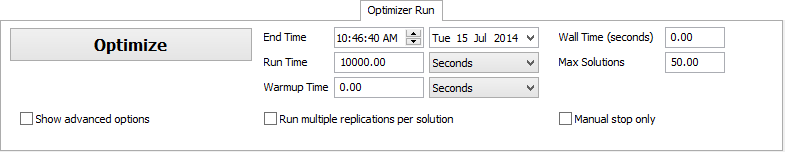
Optimize
Clicking this button begins the optimization process.
End Time
The simulation date and time each solution will end. Based upon the Model Start Date and Time as defined in Model Settings.
Run Time
This is the time in model units that each solution will run.
Warmup Time
The simulation time that each solution will run to before resetting their statistics. Statistics will thus only be collected for the time period (Run Time - Warmup Time).
Wall Time (seconds)
This is the maximum real time the optimizer will spend generating solutions. Once the wall is hit, the active solutions will finish running and then the optimization run will stop.
Max Solutions
The maximum number of solutions the optimizer will generate and test.
Run multiple replications per solution
If checked, the optimizer will run multiple replications for each solution that is generated.
Manual stop only
Sets the optimizer to run until the user stops it.
Advanced Options
Check the Show advanced options checkbox to display additional properties:
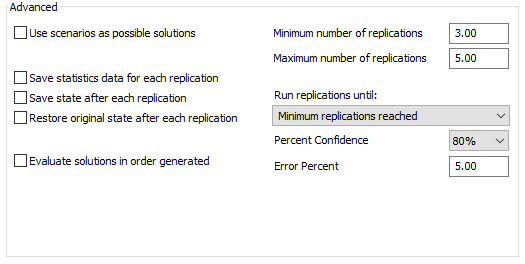
The following advanced properties are available:
- Use scenarios as possible solutions - Use manually-defined scenarios (from the Scenarios page) as initial search points. This gives the optimizer a place to begin it's optimization process and generally shortens the optimization time.
- Save dashboard data for each replication - Check to save data from dashboard statistics at the end of each replication for post-optimization reports/analysis.
- Save state after each replication - Check to save the full state of the model to a file at the end of each replication.
- Restore original state after each replication - Check to restore a clean copy of the model after each replication.
- Evaluate solutions in order generated - Check to ensure solutions are evaluated in the order they are generated. This is slower, but ensures that the optimization search is repeatable.
- Run multiple replications per solution - If
checked, the following options are made available:
- Minimum number of replications - The minimum number of replications that will always be performed for each solution.
- Maximum number of replications - The maximum number of replications that will always be performed for each solution. If set to -1, no maximum will be used.
- Run replications until - Each solution will run replications until the chosen condition is met or the maximum number of replications is reached (if not set to -1).
- Percent confidence - Percent confident that the solution falls within the specified error percent of the mean value of the replications.
- Error percent - Determines the range about the mean for which the percent confidence applies. Must be a value between 0 and 100.
The Optimizer Results Tab
The Optimizer Run tab has the following properties:
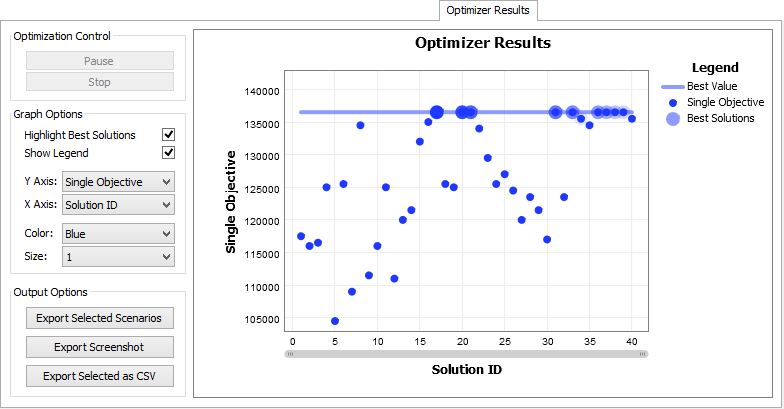
Optimization Control
If the optimizer is currently running through scenarios, you can pause or stop the optimization process.
Graph Options
These options allow you to customize the look of the graph and define what values to plot against the X and Y axes.
Export Selected Scenarios
This option will take the selected scenarios (click on a scenario in the graph to select) and export their data to the scenarios table of the Scenarios tab. This allows you to either run further experiments on the chosen scenarios, or to set your model to one of the selected scenarios by using the Choose default reset scenario.
Export Screenshot
Saves the currently displayed results graph as a PNG file.
Export Selected as CSV
Exports the data from the selected scenarios to a CSV file.
Optimizer Results Graph
Displays the results of the optimizer. If the optimizer is currently running through scenarios, you can pause or stop the optimization process.
The Advanced Tab
The Advanced tab has the following properties:
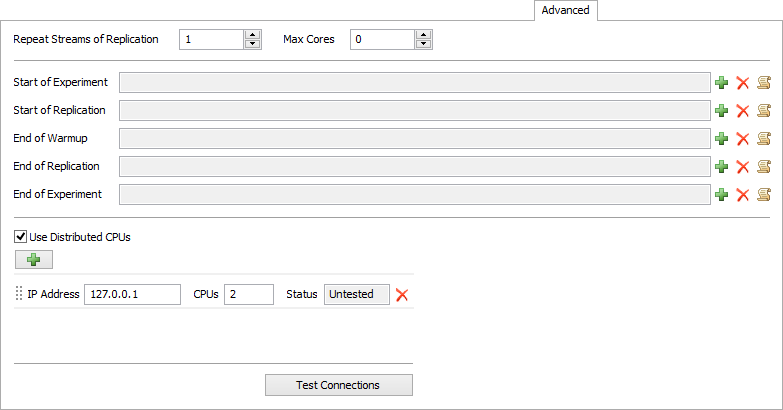
Repeat Streams of Replication
Specify a replication to set the manual model runs (not experimenter replications) to use the same random number streams. You must be repeating random streams for this to take effect.
Max Cores
Specify the maximum number of cores for the experimenter to use. The value 0 indicates that all available cores should be used. This property is ignored if using distributed CPUs.
Use Distributed CPUs
When checked, this property indicates that the Experiment or Optimization should utilize CPUs at the specified IP addresses. This will only work if the servers at the specified IP addresses are running the FlexSim Webserver on port 80. In addition, all servers must have FlexSim installed (licenses are not required for these installations). To run the Experiment or Optimization, use the Run Experiment or Run Optimization buttons as normal.
Distributed CPU List
This list allows you to add, edit, and remove connections to external CPUs. For each entry on the list, you can specify the IP address, and how many CPUs are available at that address.
Test Connections
Clicking this button tests each connection listed. If the connection fails, then there FlexSim was unable to connect with a server on port 80 at the specified address. This does not verify that the remote server is the FlexSim Webserver, or that FlexSim is installed on that server.
The Performance Measure Results Tab
This tab allows you to compare performance measures between the different scenarios. Select the Performance Measure and graph type. The graph types available are: Replications Plot, Frequency Histogram, Correlation Plot, Data Summary, and Raw Data. It has the following properties, which change depending on which graph type is selected:
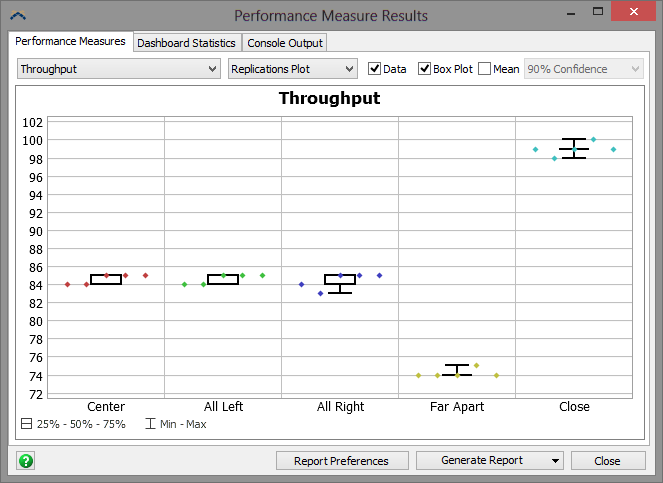
Replications Plot

The Replications Plot graph type has the following properties:
- Data - If checked, the replications plot will plot the data points for all replications.
- Box Plot - If checked, the replications plot will display a box plot.
- Mean - Check the box to display the mean confidence interval for each scenario. You can specify the percentage as 90%, 95% or 99% Confidence.
Frequency Histogram

The Frequency Histogram graph type has the following property:
- Number of Bars - Specifies the size of range to display.
Correlation Plot

The Correlation Plot graph type has the following property:
- Correlate with - Select another performance measure to plot the current performance measure against.
Data Summary

The data summary option displays summary values for each scenario, including a confidence interval on the mean of the performance measure, as well as sample standard deviation and min and max values. Note that, while the confidence percentage you choose represents the confidence that the true mean lies within the interval, the likelihood that all confidence intervals simultaneously contain their respective true means is less than that of a single confidence interval. See Simulation Modeling & Analysis by Averill Law, 5th Edition, section 9.7.
The Data Summary graph type has the following properties:
- Mean Based on - Displays values based on the selected confidence interval.
- Report Preferences - Opens the Performance Measures Report Preferences window. This allows you to prune what data you want included in the report.
- Generate Report - There are two options for
generating reports:
- Report Format - This creates an html file with full results for all performance measures.
- Web Viewer Format - This creates an html file that is interactive. When you open the html file you can choose which graphs you'd like to view.
Scenario Comparison

The Scenario Comparison graph type has the following property:
- Mean Based on - Displays values based on the selected confidence interval.
- Scenario Comparison Based on - Select the scenario to compare the other scenarios against.
Dashboard Statistics Tab
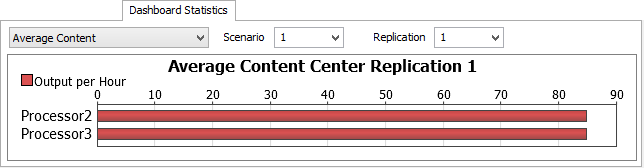
If you have have checked the box Save Dashboard Data for Each Replication in the Experiment Run tab before running the experiment, then you can go to the Dashboard Statistics tab to view individual replication results for various dashboard statistics. Choose the statistic, replication and scenario, and the statistic's associated graph will be shown.
Console Output Tab
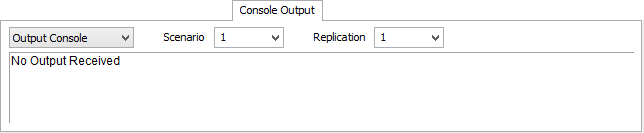
FlexSim also saves the text output of the Output Console and the System Console for each replication. This can be used for debugging/analysis of each replication. Choose Output or System Console and the scenario and replication you want to view.