State Pie Template
Overview and Key Concepts
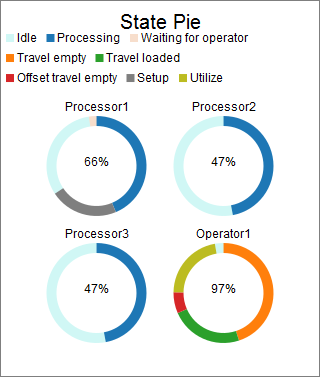
This chart template creates a pie chart, and calculates utilization based on each object's time in various states. Each segment of the pie chart represents the proportion of time spent in one of the object's states.
Properties Panels
The State Pie template uses the following properties panels: