Legacy Process Flow Chart Properties
Introduction to Chart Properties
This topic is a reference page that will describe and explain each of the properties available in the Chart Properties window.
The properties are organized by the name of the tab in which they appear in the Chart Properties window.
Objects
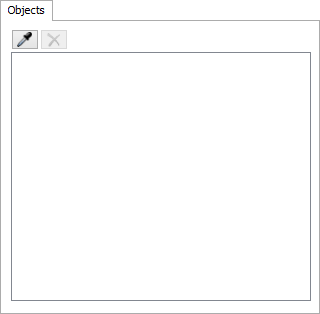
Use the Objects tab to add activities, shared assets, or lists to a Process Flow chart. Other objects cannot be added to this chart type.
The following image shows the Objects tab of the Chart Properties window:
Statistics
Use the Statistics tab to add the specific statistics the chart should track and display.
The following image shows the Statistics tab of the Chart Properties window:
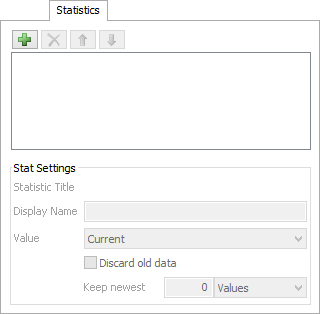
This tab has the following properties:
- Add - The Add button opens a menu, displaying a complete list of all the statistics that can be displayed using the Process Flow chart.
- Up/Down - The Up and Down arrows can be used to reorder the statistics. This affects the column order on Table charts, and the bar order on Bar charts. It has no effect on Time charts.
- Statistic Title - The Statistic Title displays the
true title of the statistic. This is the name of the statistic that is passed to the
getstatcommand. - Display Name - The Display Name is a custom name for each statistic that displays on the chart. This affects column names in Table charts, and bar names in Bar charts. It does not affect Time charts.
- Value - Use the Value list drop-down to select
which the value, based on this statistic, that you want the chart to display.
- Current
- Minimum
- Maximum
- Average
- Standard Deviation
- Discard old data Check this box to discard old data when calculating a derivative value (minimum, maximum, average, standard deviation).
- Keep newest Use these two fields to specify how long of a history to keep. For example, if you want to keep only the last 10 values for an average, you would enter a 10 in the field, and select Values from the list drop-down. If you want to keep the last hour of data, you would enter a 1 in the field, and select Hours from the list drop-down.
Runtime
Some statistics may not exist until the model runs. This true for List partitions, which are created on demand. The Runtime tab allows you to specify which partitions (by partition ID) you want to chart data for. If you don't have a List object on the chart, this page is irrelevant.
The following image shows the Runtime page of the Chart Properties window:
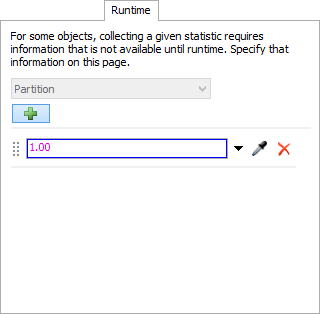
To add a List partition to the chart, select one of the List statistics in the
Statistics page. Then click the Add
 button to add a field. In that field, enter
in the partition ID, usually a number or a string.
button to add a field. In that field, enter
in the partition ID, usually a number or a string.
Groups
Use the Groups tab to group statistics by activities or process flow instances. The following image shows the Groups tab of the Chart Properties window:
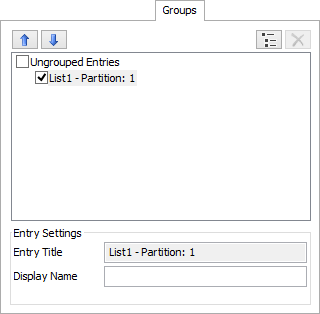
The properties on this page are explained in the following sections:
- Up/Down The Up and Down buttons move the selected item (either a group or an Entry) up or down, respectively.
- Group The Group button is used to move a selected Entry into a new or existing group.
- Entry List The Entry List shows a list of all Entries, and which group they are in. Each Group and Entry have a checkbox next to their name. If an Entry is checked, it will be included on the chart. If a Group is checked, then the chart will display the entries as members of the group. Otherwise, the entries will be included on the chart individually.
- Entry Title The Entry Title field is visible if you have selected an Entry. It displays the auto-generated name of the Entry, which describes how the data for each statistic is being retrieved.
- Display Name Both groups and Entries have a Display Name. This is the name that appears on a Bar Chart or Data Table. For Entries, if the Display Name is blank, the auto-generated name is used.
- Combined Value The Combined Value field only appears when you have selected a group. This determines how the statistics for each member of the group are combined for the group statistic. The only options are Sum and Average.
Series
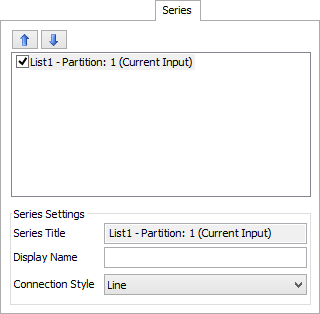
Use the Series tab to manage which data series appear on your chart. It shows a list of every valid Entry/Statistic combination, which is called a Series.
The following image shows the Series tab of the Chart Properties window:
The properties on this page are explained in the following sections:
- Up/Down - The Up and Down buttons move the selected Series up or down, respectively.
- Series List The Series List shows the plottable data for the chart. A Series can be excluded from the chart by unchecking the box next to its name.
- Series Title The Series Title is the name of the Entry and the Statistic that were used to create the Series.
- Display Name The Display Name is shown on the graph. If it is blank, the Series Title is used instead.
- Connection Style The Connection Style determines how data points in a Series are connected on the graph.
Colors
Use the Colors tab in the Chart Properties window to change the chart's color scheme.
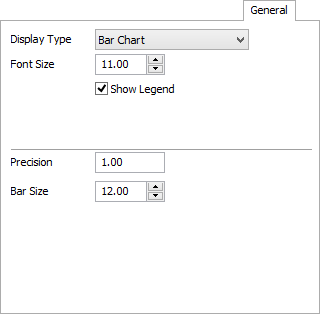
General
Use the General tab to change the chart type and adjust other general display settings. The following image shows the General tab of the Chart Properties window:
The properties on this page are explained in the following sections:
- Display Type - The Display Type drop-down list box allows you to change the type of chart being displayed.
- Font Size - The Font Size field allows you to change the size of font used to draw the chart.
- Show Legend - The Show Legend checkbox controls whether or not the chart displays a legend.
- Precision - The Precision field is only available for Bar Charts and Data Tables. You can use this field to specify the precision the chart will use to display data.
- Bar Size - The Bar Size field is only available for Bar Charts. You can use this field to specify the size of the bars.
- Time Scale - The Time Scale field is only available for Time Charts. You can use this field to scale the x axis by the specified amount.
- X Axis Title - The X Axis Title is only available for Time Charts. You can use this field to set the name of the x axis on the chart.
- Y Axis Title - The Y Axis Title is only available for Time Charts. You can use this field to set the name of the y axis on the chart.