Tutorial Task 2.6 - Pick Time By Type
Task Overview
In this task, you will create a Statistics Collector that records the time required for an operator to pick each item. A pick is the time it takes an operator to travel to an item, load it, and unload it at their station:
This task is based on the same model that was used in the Task 1 of this series. For information on how to open the model, please refer to that task:
Step 1 Add Events to the Statistics Collector
In this step you will add events to the statistics collector. To do this:
- Click on the Toolbox tab on the left of the screen and click the
 button to add a new tool. Navigate to the
Statistics section and select Statistics Collector.
This will open a properties window.
button to add a new tool. Navigate to the
Statistics section and select Statistics Collector.
This will open a properties window. - Click on the field at the top and rename the statistics collector to PickTimeByType.
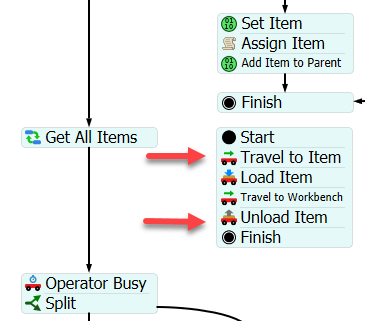
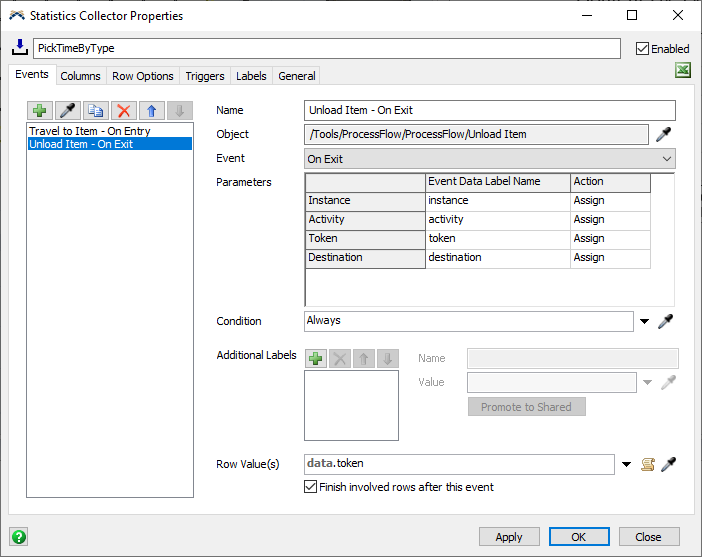
- Be sure the ProcessFlow view is open, and that the Travel to Item and Unload Item activities are visible.
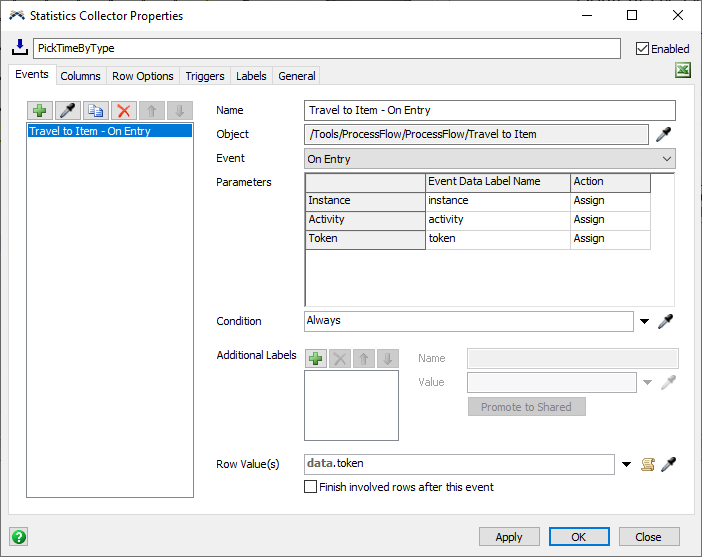
- On the Events tab, click the sampler button
 .
Then click on the Travel to Item activity,
and choose the On Entry option.
.
Then click on the Travel to Item activity,
and choose the On Entry option.
- In the Row Value(s) field, type the following code:
data.token - In the top left of the Events tab,
click the sampler button
. Then click on the
Unload Item activity, and choose the On Exit
option.
- In the Row Value(s) field, type the following code:
data.token - Check the Finish involved rows after this event box.
Explanation
So far, you have seen that a row value is connected with a row in the table. In addition to the row itself, each row value is connected to a set of labels. These labels are called Row Labels. Row labels allow you to have values associated with each row, but that aren't necessarily visible in the table. Row labels are usually set using the On Row Adding and On Row Updating triggers. They are usually used as part of a column's value.
In this step, you listened to two events. These two events signify the beginning and end of a single pick. Both events use the token that is going through the associated activities as the row value. This means the table will have one row per token. The second event finishes the row.
This statistics collector will use the first event to create a row, and use a row label to record when that row was created. In this way, each row can store the pick start time, without showing it in the table. The statistics collector will use the second event to record the duration between the first and seond events.
Step 2 Add Columns to the Statistics Collector
In this step, you will add columns to the Statistics Collector. To do this:
- Click on the Columns tab.
- Click the button once again
and choose Add column.
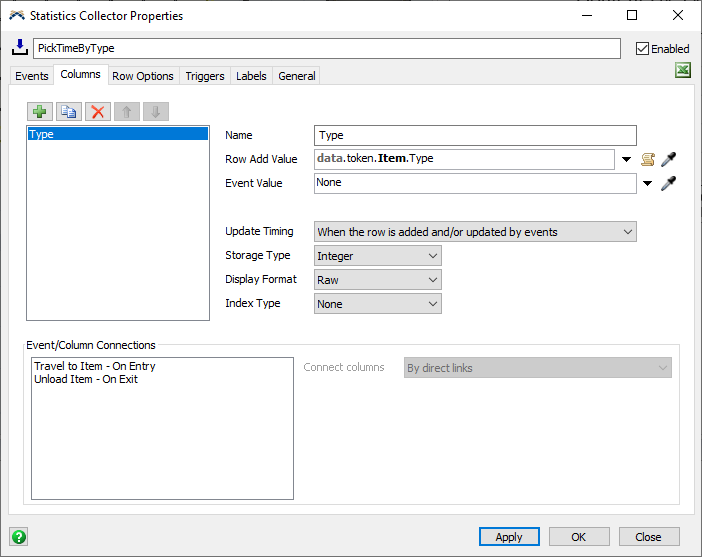
- In the Name field, rename this column to Type.
- Set the Row Add Value to the following code:
data.token.Item.Type. - Set the Storage Type property to Integer.
- Click the button once again
and choose Add column.
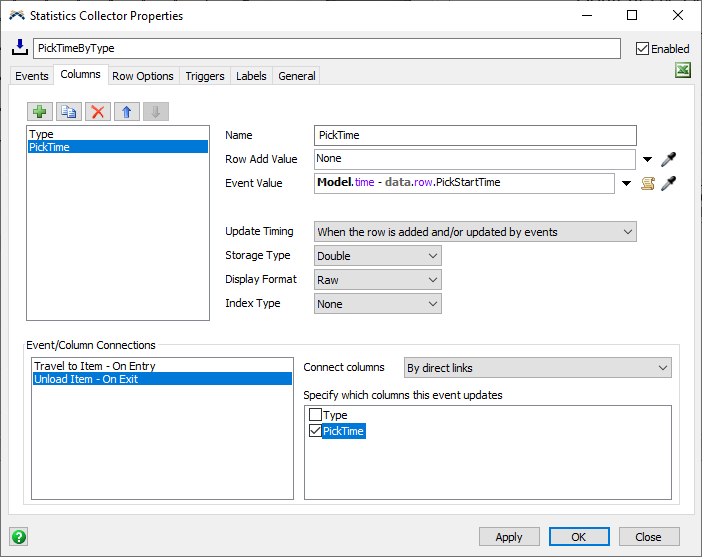
- In the Name field, rename this column to PickTime.
- Set the Event Value to the following code:
Model.time - data.row.PickStartTime - In the Event.Column Connections area, select the Unload Item - On Exit event. Then check the box for the PickTime column.
Explanation
In this step, you added two columns: Type and PickTime. The Type column is straightforward; when a new pick begins, a new row is added to the table, and this column will record the Type of the item being picked. In the next step, you will create a row label called PickStartTime, and set its value when the row is added.
The PickTime column won't be set until the second event fires. At that point, this column will be set to the difference between the current time and the PickStartTime label.
Step 3 Add Triggers to the Statistics Collector
In this step, you will add triggers to the Statistics Collector. To do this:
- Click on the Triggers tab.
- Click the plus button
and choose On Row Adding.
- Click the plus button
in the On Row Adding trigger and choose
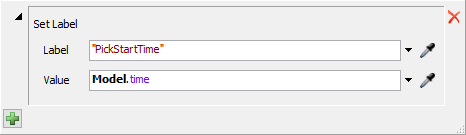
Set Row Label.
- Set the name of the label to
"PickStartTime". Set the value of the label toModel.time - Click off the popup to close it.
- Click the Apply button.
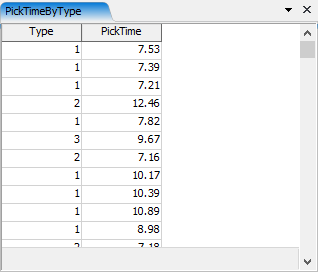
You can right click on the PickTimeByType collector in the Toolbox and select the View Table option. If you reset and run the model, you will see the table record the output by type each hour. You may wish to run the model as fast as possible to see the data populate.
Explanation
The statistics collector listens to the On Entry of the Travel to Item activity. When that event happens, it yields the token as the row value. The statistics collector adds a row for that token, and records the Type value. In addition, the statistics collector records the current time on a label called PickStartTime. Since each row has its own labels, each row records when it was added in that row's PickStartTime label.
The statistics collector also listens to the On Exit of the Unload Item activity. When that event happens, it yields the token as the row value. Since there is already a row for that token, the statistics collector doesn't need to add a new row. However, the PickTime column is connected to this event, so the statistics collector updates the value of that column. That column value uses the current time and the PickStartTime row label to calculate the pick time. This second event also finishes the row.
Step 4 Creating a Chart
Now you will create a chart to show the data in the statistics collector as a box plot. To do this:
- Click the Dashboards button at the top of the screen and select the Add a Dashboard option.
- While the dashboard view is active, navigate to the library on the left. Under the Base Chart Types section, find and drag a Box Plot chart onto the dashboard. This will open the new chart’s properties window.
- Click on the Data Source field and select the PickTimeByType collector from the options.
- Set the Values property to the PickTime column.
- In the Color Split By area, check the Type column box.
- Click on the Settings tab.
- Check the Show Points box.
- Click on the Text tab.
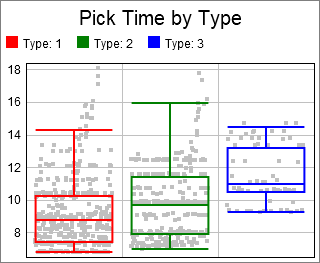
- Check the Custom Title box, and set the custom title to Pick Time by Type.
- In the Show Column Headers area, check the box for the Type column.
- Click on the Colors tab.
- Click the Edit Values button, and choose Remove all colors.
- Click the plus button
three times to add three colors.
- Click the Apply Button.
If you reset and run the model now, the box chart will show the data in the statistics collector. As before you may have to run the model for some time to see the results.