The Options panel displays different chart options depending on the type of chart.
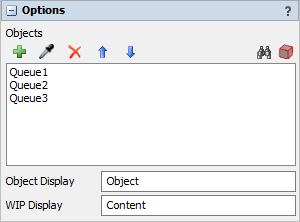
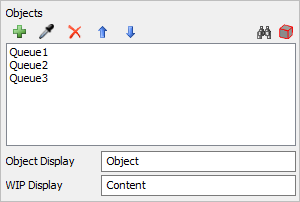
Content Options
The options panel for Content charts has the following properties:
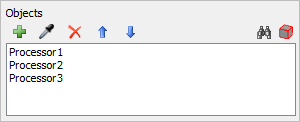
Objects
Specifies the objects to include on the chart. See
Adding Objects
for more information.
Object Display
Specifies the name of the Object column.
WIP Display
Specifies the name of the WIP column.
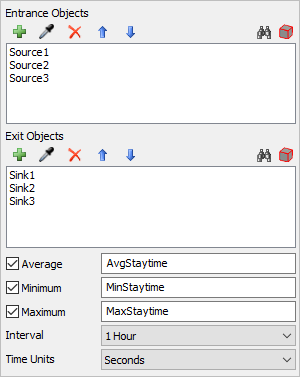
Composite Staytime Options
The options panel for composite staytime charts has the following properties:
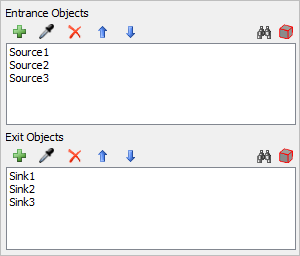
Entrance Objects
Specifies the objects that define where the composite object begins. See
Adding Objects
for more information.
Exit Objects
Specifies the objects that define where the composite object ends. See
Adding Objects
for more information.
Average Staytime
Use the checkbox to specify whether the Average Staytime column is shown on the chart.
If shown, you can change the column name using the associated edit field.
Minimum Staytime
Use the checkbox to specify whether the Minimum Staytime column is shown on the chart.
If shown, you can change the column name using the associated edit field.
Maximum Staytime
Use the checkbox to specify whether the Maximum Staytime column is shown on the chart.
If shown, you can change the column name using the associated edit field.
Interval
Sets the interval for the template. All staytime values are recorded during each interval.
The template then computes the average of those staytimes.
Time Units
Specifies the time units that should be used on the chart.
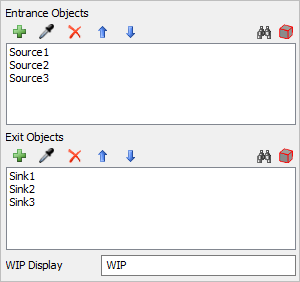
Composite WIP Options
The options panel for composite WIP vs time charts has the following properties:
Entrance Objects
Specifies the objects that define where the composite object begins. See
Adding Objects
for more information.
Exit Objects
Specifies the objects that define where the composite object ends. See
Adding Objects
for more information.
WIP Display
Specifies the name of the WIP data in the legend.
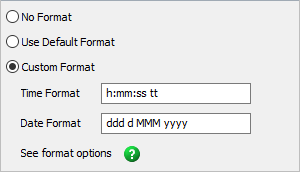
Date Time Display Options
The options panel for date time displays has the following properties:
No Format
Displays the current elapsed model time from Day 1 at the time specified in the Model
Settings window with the format: Day 1, 08:00:00
Use Default Format
Displays the current model date and time as defined in the Model Settings window.
Custom Format
Displays the current model date and time using a custom format.
Financial Analysis Options
The options panel for date time displays has the following properties:
Icon
Description
Adds objects/groups to the current list of objects. Objects and groups may be
added multiple times.
Removes objects/groups from the current list of objects.
Moves the selected object up in the list
Moves the selected object down in the list
Sample an object in the model.
There are five ways to add objects to this chart:
Browse by Class - This method of adding objects
sorts the objects by class. To select an entire class, click on the type icon. Click on
an object to select or deselect it.
Browse by Group - This method of adding objects
sorts the objects by group. To select an entire group, click on the type icon. Click on
an object to select or deselect it.
Browse by Object - This method of adding objects
lists all objects in the model. Click on an object to select or deselect it.
Select by Dragging - This method of adding objects
uses the 3D model view. Simply drag the target icon from the current window to an object
in the model you would like to add.
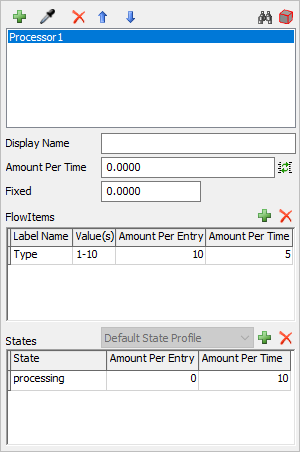
Display Name
Enter text to display on the graph. Leave this field blank to display the object or group
name.
Fixed
This value is added once when the model is reset. This value might represent the initial
purchase price of a resource.
Amount Per Time
This value is continually added as the model runs. A value of 1.0 would mean at time 50.0
the total time value for the object would be 50.0. Use the Convert Units tool to convert
units to model time units.
FlowItems
Use the and
to add or remove items from the table.
Each item has an Label Name, Value(s), Amount Per Entry and Amount Per Time. To apply the
values to all label values, leave the Value(s) field blank. To define multiple label values,
separate numbers using commas and dashes. For example: 1,2,5,10-15,20
Amount Per Entry value is applied when a FlowItem with the specified label value
enters the object.
Amount Per Time value is applied continually while the flowitem with the specified
label value is in the object.
Use the Convert Units tool to convert units to model time units.
States
Use the and
to add or remove items from the table.
Each item has a State, Amount Per Entry and Amount Per Time.
Amount Per Entry value is applied when the object enters the specified state. If an
object is in
the state for 0 time, the fixed value will NOT be applied.
Amount Per Time value is applied continually while the object is in the specified
state.
Use the Convert Units tool to convert units to model time units.
Item Trace Gantt Options
The options panel for item trace gantt charts has the following properties:
Entrance Objects
Specifies the objects at which to begin tracking items. See
Adding Objects
for more information.
Exit Objects
Specifies the objects at which to stop tracking items. See
Adding Objects
for more information.
Milestone Options
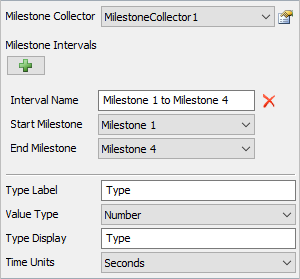
The options panel for milestone charts has the following properties:
Milestone Collector
Specifies the Milestone Collector to use as a data source.
Milestone Intervals
Specifies one or more Intervals to display on the chart. For more information, see the
Intervals section.
Type Label, Value Type
These properties are common to all By Type templates. For more information, see
By Type Templates.
Type Display
Specifies how the chart should display the Type.
Time Units
Specifies the units to use for the interval duration value.
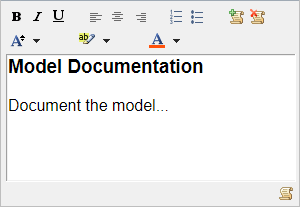
Model Documentation Options
The options panel for model documentation charts has the following properties:
Icon
Description
This button makes the selected text bold. If the whole selection is already
bold, this button removes the bold effect.
This button italicizes the selected text. If the whole selection is already
italicized, this button removes the italics.
This button underlines the selected text. If the whole selection is already
underlined, this button removes the underline.
This button makes the text on the current line left justified. If multiple lines
are selected, all lines are left justified.
This button makes the text on the current line right justified. If multiple
lines are selected, all lines are right justified.
This button makes the text on the current line right justified. If multiple
lines are selected, all lines are right justified.
This button places the current line in an ordered list. If multiple lines are
selected, all lines are placed in the list.
This button places the current line in an unordered list. If multiple lines are
selected, all lines are placed in the list.
This button inserts a section of flexscript code, which can be used to
dynamically update the model documentation based on the model itself.
This button removes the current section of flexscript.
This button changes the font of the current selection to be the specified
size.
This button highlights the selected text in the specified color.
This button changes the font color of the selected text to the specified
color.
This button toggles the view between the visual editor and the html editor.
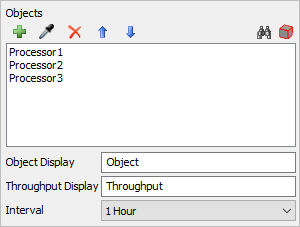
Output Options
The options panel for output charts has the following properties:
Objects
Specifies the objects to include on the chart. See
Adding Objects
for more information.
Object Display
Specifies the name of the Object column.
Throughput Display
Specifies the name of the Throughput column.
Interval
Specifies the time interval for the chart. For time plots, the line will show the total output for the previous interval.
Otherwise, the value displayed in the chart is Output divided by n, where n is the number of Intervals
that have elapsed.
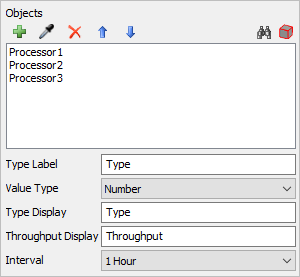
Output By Type Options
The options panel for output by type charts has the following properties:
Objects
Specifies the objects to include on the chart. See
Adding Objects
for more information.
Type Label, Value Type
These properties are common to all By Type templates. For more information, see
By Type Templates.
Type Display
Specifies the name of the Type column.
Throughput Display
Specifies the name of the Throughput column.
Interval
Specifies the time interval for the chart. For time plots, the line will show the total output for the previous interval.
Otherwise, the value displayed in the chart is Output divided by n, where n is the number of Intervals
that have elapsed.
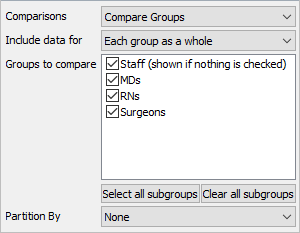
People Options
The options panel for people charts has the following properties:
Comparisons
Choose what kind of comparisons you would like to see on this chart. There are four possible options:
None - Show data for all Staff objects
Compare Groups - Choose which groups you would like to compare in the table.
Each selected group will appear in the table in the Subset column.
Compare hours of the day - Compare utilization across different hours.
Compare days of the week - Compare utilization across different days of the week.
Include data for
If comparing groups, specifies which data to include on the chart. There are three possible options:
Each group as a whole - Shows data aggregated for each selected group.
Each member of each group - Shows data for each individual in the selected groups.
If an individual is in more than one group, they will be shown twice.
Each group and each member - Shows data for a group followed by the individuals
in that group for each selected group.
Groups to compare
If comparing groups, choose which groups you would like to compare in the table.
Each selected group will appear in the table in the Subset column.
Select all subgroups
If comparing groups, click to select all groups except the top group.
Clear all subgroups
If comparing groups, click to clear the selection of all groups except the top group.
Partition By
Choose how to partition result data within the table. Partitions will be applied in addition
to the group comparisons.There are three available options:
None - No partition will be used.
By Hour of Day - Data will be partitioned by the hour
of day, up to 24 hours.
By Day of Week - Data will be partitioned by
week day, Sunday through Saturday.
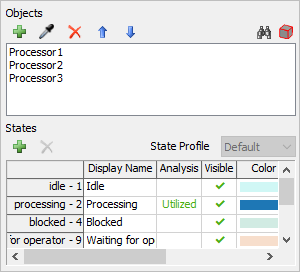
State Options
The options panel for state charts has the following properties:
Objects
Specifies the objects to include on the chart. See
Adding Objects
for more information.
States
This table updates when objects are added. Each row of the table allows you to edit the following attributes:
Display Name - Specifies the name of the state, as seen on the chart. You can edit this field
by double clicking on the cell and typing a new name.
Analysis - Specifies how this state influences the utilization statistic, calculated by this template.
You can edit this value by clicking on the cell. This will rotate through three possible values:
(blank) - Indicates that time spent in this state should be considered "not utilized"
Utilized - Indicates that time spent in this state should be considered "utilized"
Excluded - Indicates that time spent in this state should be excluded from the utilization calculation.
Visible - Specifies whether the state will appear on the chart. You can edit this value by clicking on the
cell, which will toggle whether the state is visible.
Color - Specfies what color the state should have. You can edit this value by clicking on the
cell, which will allow you to pick a new color for this state.
Additional states can be added to the table using the button.
States may be removed from the table using the button.
If all included objects share an additional state profile, you can create a chart of that profile using the
State Profile property. By default, utilized states are shown before non-utilized states.
Also by default, non-utilized state colors are transparent.
State Gantt Options
The options panel for state charts has the following properties:
Objects
Specifies the objects to include on the chart. See
Adding Objects
for more information.
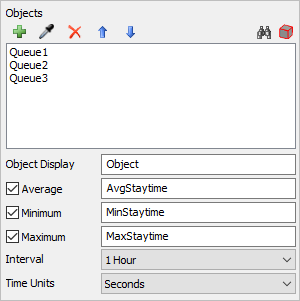
Staytime Options
The options panel for staytime charts has the following properties:
Objects
Specifies the objects to include on the chart. See
Adding Objects
for more information.
Object Display
Specifies the name of the Object column.
Average Staytime
Use the checkbox to specify whether the Average Staytime column is shown on the chart.
If shown, you can change the column name using the associated edit field.
Minimum Staytime
Use the checkbox to specify whether the Minimum Staytime column is shown on the chart.
If shown, you can change the column name using the associated edit field.
Maximum Staytime
Use the checkbox to specify whether the Maximum Staytime column is shown on the chart.
If shown, you can change the column name using the associated edit field.
Interval
Sets the interval for the template. All staytime values are recorded during each interval.
The template then computes the average of those staytimes.
Time Units
Specifies the time units that should be used on the chart.
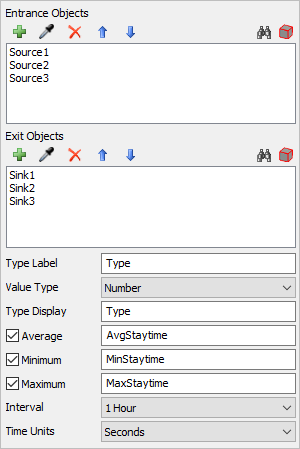
Staytime By Type Options
The options panel for staytime by type charts has the following properties:
Entrance Objects
Specifies the objects that define where the composite object begins. See
Adding Objects
for more information.
Exit Objects
Specifies the objects that define where the composite object ends. See
Adding Objects
for more information.
Type Label, Value Type
These properties are common to all By Type templates. For more information, see
By Type Templates.
Type Display
Specifies the name of the Type column.
Average Staytime
Use the checkbox to specify whether the Average Staytime column is shown on the chart.
If shown, you can change the column name using the associated edit field.
Minimum Staytime
Use the checkbox to specify whether the Minimum Staytime column is shown on the chart.
If shown, you can change the column name using the associated edit field.
Maximum Staytime
Use the checkbox to specify whether the Maximum Staytime column is shown on the chart.
If shown, you can change the column name using the associated edit field.
Interval
Sets the interval for the template. All staytime values are recorded during each interval.
The template then computes the average of those staytimes.
Time Units
Specifies the time units that should be used on the chart.
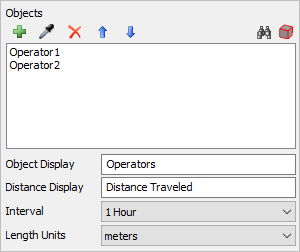
Travel Distance Options
The options panel for travel distance charts has the following properties:
Objects
Specifies the objects to include on the chart. See
Adding Objects
for more information.
Object Display
Specifies the name of the Object column.
Distance Display
Specifies the name of the distance traveled statistic in the legend.
Interval
Sets the interval for the template.
Length Units
Sets the units the distance will be measured by.
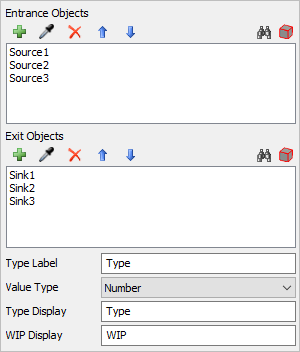
WIP By Type Options
The options panel for WIP by type charts has the following properties:
Entrance Objects
Specifies the objects that define where the composite object begins. See
Adding Objects
for more information.
Exit Objects
Specifies the objects that define where the composite object ends. See
Adding Objects
for more information.
Type Label, Value Type
These properties are common to all By Type templates. For more information, see
By Type Templates.
Type Display
Specifies the name of the Type column.
WIP Display
Specifies the name of the WIP statistic in the legend.
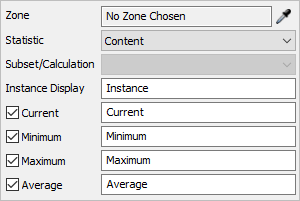
Zone Statistics Options
The options panel for zone statistics charts has the following properties:
Zone
Specifies the Zone to use as a data source.
Statistic
Specifies which statistic to collect from the Zone. If you want to gather a Partition statistic, use the
Zone Partition Statistics Table
template, instead of this template.
Subset/Calculation
Specifies which Subset or Subset Calculation to gather statistics from, if required. If the chosen statistic
does not require a Subset or Subset calculation, the only option will be "None". Otherwise, this combo box will
contain a listof all Subsets, or Subset calculations, based on the chosen statistic.
Instance Display
Specifies the name of the Instance column, if the instance column is present.
Current
Specifies whether the Current column is present. If checked, you can edit the name of this column in the associated edit field.
Minimum
Specifies whether the Minimum column is present. If checked, you can edit the name of this column in the associated edit field.
Maximum
Specifies whether the Maximum column is present. If checked, you can edit the name of this column in the associated edit field.
Average
Specifies whether the Average column is present. If checked, you can edit the name of this column in the associated edit field.
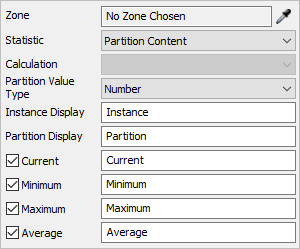
Zone Partition Statistics Options
The options panel for zone partition statistics charts has the following properties:
Zone
Specifies the Zone to use as a data source.
Statistic
Specifies which statistic to collect from the Zone. If you want to gather a statistic besides a Partition statistic, use the
Zone Statistics Table
template, instead of this template.
Calculation
Specifies which Partition Calculation to gather statistics from, if required. If the chosen statistic does not require a Partition
Calculation, the only option will be "None". Otherwise, this combo box will contain a list of all Partition Calculations.
Partition Value Type
Specifies whether the partition value is text, or if it is a number.
Instance Display
Specifies the name of the Instance column, if the instance column is present.
Partition Display
Specifies the name of the Partition column.
Current
Specifies whether the Current column is present. If checked, you can edit the name of this column in the associated edit field.
Minimum
Specifies whether the Minimum column is present. If checked, you can edit the name of this column in the associated edit field.
Maximum
Specifies whether the Maximum column is present. If checked, you can edit the name of this column in the associated edit field.
Average
Specifies whether the Average column is present. If checked, you can edit the name of this column in the associated edit field.


 to convert units to model time units.