Output per Hour by Type vs Time Template
Overview and Key Concepts
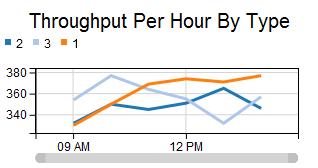
This composite template creates a time plot, with one colored line per type value. The line shows the throughput for that type from the previous hour, every hour. For more information about Output templates, see Output Templates.
Properties Panels
The Output per Hour by Type vs Time template uses the following properties panels: