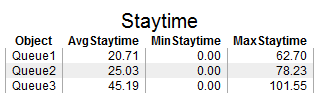
This template creates a chart with up to four columns. The first column shows the
object. The other three columns show
the average, minimum, and maximum staytime for the object.
Entrance Objects - Specifies the objects that define
where the composite object begins.
See Adding Objects for more information.
Exit Objects - Specifies the objects that define
where the composite object ends.
See Adding Objects for more information.
Object Display - Specifies the name of the Object column.
Average Staytime - Use the checkbox to specify whether the Average Staytime
column is shown on the chart. If shown, you can change the column name using the associated edit field.
Minimum Staytime - Use the checkbox to specify whether the Minimum Staytime
column is shown on the chart. If shown, you can change the column name using the associated edit field.
Maximum Staytime - Use the checkbox to specify whether the Maximum Staytime
column is shown on the chart. If shown, you can change the column name using the associated edit field.
Time Units - Specifies the time units
that should be used on the chart.
The Settings Tab
The Settings tab is identical to the Table Settings tab. For more information,
see Table Settings.
The Advanced Tab
This template, like all templates, uses the Advanced Tab. For more information,
see Advanced Tab.