Zone Partition Statistics vs Time Template
Overview and Key Concepts
This template is a Zone template. It assumes that you already have a Zone in a process flow in your model, and that you want to create a chart based on partition statistics from that Zone.
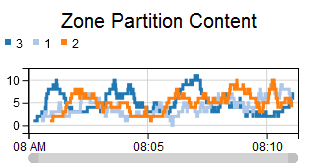
This template creates a time plot. The time plot will show the value of the chosen partition statistic through time. Each partition will be represented by a different colored line. If you choose a local Zone of an instanced flow, then there will be one line per partition per instance.
Properties Panels
The Zone Partition Statistics vs Time template uses the following properties panels: