Interval Histogram Template
Overview and Key Concepts
This template is a Milestone Template. It assumes that you already have a Milestone Collector in your model, and that you want to create a chart based on data from that collector.
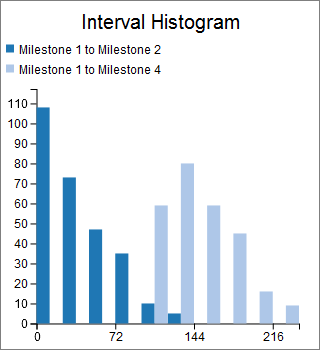
This template creates a Histogram, which shows the distribution of Interval times for each specified Interval. Different intervals are represented with different colors.
Properties Panels
The Interval Histogram template uses the following properties panels: