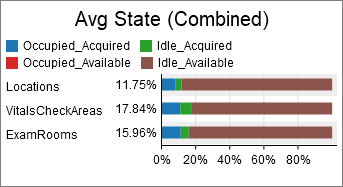
This chart template creates a bar chart, and calculates utilization based on each object's time in various states.
The tables/metrics tab is used by many Location State templates. For more information, see the Location Avg State Pie topic.
The options tab is used by many Location State templates. For more information, see the Location Avg State Pie topic.
The settings tab is identical to the Bar Chart's settings tab. For more information, see the Bar Chart topic.
The text tab is identical to the Bar Chart's text tab. For more information, see the Bar Chart topic.
The colors tab is identical to the Bar Chart's colors tab. For more information, see the Bar Chart topic.
This template, like all templates, uses the Advanced Tab. For more information, see Advanced Tab.