Using the Statistics Collector
About the Statistics Collector
Before reading this topic, consider reading Key Concepts About Getting Data to ensure you are familiar with the overall processes and tools that are involved in getting data from a simulation model.
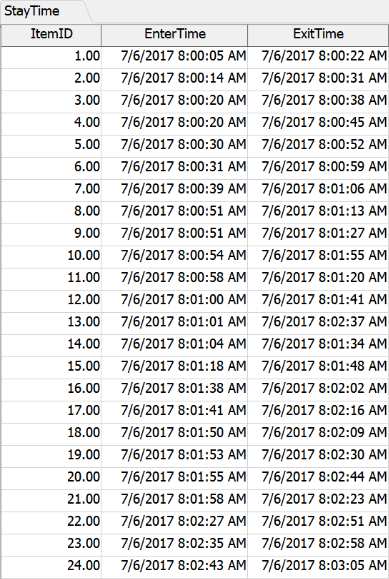
The Statistics Collector is a tool that will gather data from the objects and events you specify during a simulation run. During a simulation run, a statistics collector will listen to these objects and put the data into a table, such as the one shown in the following example, which tracks the time at which items enter and exit an assembly line:
Once you've collected this raw data, you could possibly:
- Transform the data using the Calculated Table tool. (See Using the Calculated Table for more information.)
- Visualize the data using some of the charts available within FlexSim.
- Export the data to an external software program such as Excel or Tableau.
The Statistics Collector has two main advantages:
- It can easily adapt to meet your unique data-gathering needs. You can customize statistics collectors to gather data from nearly any event or statistic that is available during a simulation run. At the same time, the statistics collector won't guess about what data you might want and only gives you exactly what you asked for. Nothing more and nothing less. In other words, the statistics collector lets you determine exactly what data you want to gather while also allowing you to filter out any unnecessary data that you don't want.
- It gives you direct access to your simulation model's raw data. While it is sometimes useful to create charts to visualize the results of a simulation model, sometimes it's more useful to have access to the raw data from a simulation run itself. Using statistics collectors, you won't need to create a chart to get information from simulation run. All your raw data will be available in data tables that you create and define. Using the data from these tables, you can then perform more calculations, display the data in a chart in FlexSim, or export the data for further analysis using your preferred data analysis software programs.
Statistics Collector Tutorial
The best way to learn about using the Statistics Collector is to use the Statistics Collector Tutorial:
Tutorial 2 - The Statistics Collector
This tutorial will guide you through using the Statistics Collector to make many different kinds of tables and chart in FlexSim. The tutorial also explains the basic concept associated with the Statistics Collector
Statistics Collector Reference
To learn about all available options for the Statistics Collector, or to learn in how the Statistics Collector works in great detail, you can read the following reference topic:
Reference - The Statistics Collector
The reference documentation includes in-depth descriptions of how the Statistics Collector works, and how to use the user interface.