Fluid Pipe
Overview and Key Concepts
The Pipe is used to simulate the time required to move material from one object to another. It can appear as either a cylindrical pipe, or as a simple conveyor.

The Pipe carries material from one point in the model to another. It is most often needed when the modeller has to take into account the time required to move material from one point to another. It is also used if the modeller needs to send material from multiple objects to a single input port on another object or when material from one output port needs to be split.
The modeller specifies a maximum content and maximum flow rate for the Pipe. The amount of time that it takes material to travel through the Pipe is based on these two values. The maximum flow rate is used as the maximum input and output rate. The actual output rate is based on the rate that material came into the Pipe. The material will go out of the Pipe at the same rate it came in, unless the Pipe "backs up". If one of the output ports does not receive all of the material that the Pipe tries to send, the material in the Pipe "backs up" and more is available to be sent during the next tick.
The modeller also selects an output flow mode. There are three modes available. The first flow mode is called "Flow Evenly." In this mode, the Pipe attempts to divide the output rate evenly between the output ports. The second flow mode is called "First Available." In this mode, the Pipe tries to send all of the material that is ready to be sent to the first output port. If that object can not receive it all, the Pipe tries to send it to the next port, and so on. The third mode is called "User-Defined." This mode allows the modeller to edit the maximum port input and output rates, as well as the port scale factors. The modeller also has access to the AdjustInputRates and AdjustOutputRates functions. Unlike the other fluid objects, the modeller can read but can not change the object input and output rates using these two fields.
The Pipe has no level indicator bar, but does have some visual indications of its state. When the Pipe is empty, it is shown as a solid gray color. When material is moving, the Pipe is shown in the color assigned to it, but that color is fading in and out. When the Pipe is blocked and unable to send, it is drawn in its assigned color and does not change.
The modeller can change the look of the Pipe by editing the Pipe's Layout Table. Each row of the table represents a single, straight section of the Pipe. The modeller can define how long the section is and what its diameter is. They can also specify the angles around the Z and Y axis that the pipe will rotate for the next section. There is also a column that allows the modeller to state whether or not the joint between this section and the next one will be drawn. By editing this table, the modeller can make the Pipe look however they need. The modeller also has the option of displaying the Pipe as a simple conveyor. When the Pipe is drawn as a conveyor, the Layout Table is still followed, only the option to display the joints between sections is ignored.
States
For statistical purposes, the fluid blender will be in one of the following states at various points during a simulation run:
Empty
The Pipe has no material in it.
Filling
The Pipe received material, but no material has been sent out recently.
Starved
The Pipe has material, but has not sent or received any recently.
Flowing
The Pipe has material that is it currently sending downstream.
Blocked
The Pipe has material that it is unable to send downstream. The material in the Pipe is "backing up".
Properties
The fluid pipe object has seven tabs with various properties. The last five tabs are the standard tabs that are common to most fluid objects. For more information about the properties on those tabs, see:
The Statistics tab is obsolete and is not supported for this object any more. Use the Statistics group in the object's Quick Properties instead.
The remaining two tabs, the Pipe tab and the Layout tab are unique to the fluid pipe object. The properties on these tabs will be explained in more detail in the next two sections.
The Pipe Tab
The Fluid Pipe tab has the following properties:
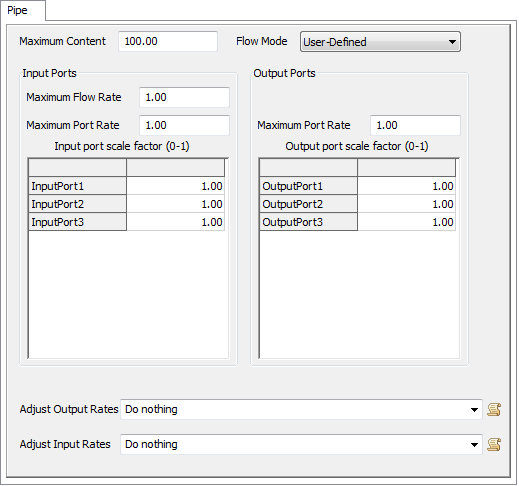
Maximum Content
The maximum amount of material that this object can hold.
Flow Mode
The Pipe has three different modes that can be used to define how fluid is sent downstream:
- Flow Evenly - The output ports are configured to have a maximum flow rate equal to the incoming flow rate divided by the number of output ports. The output ports may not send the same amount, depending on the content of the downstream objects.
- First Available - The output ports are configured to have a maximum flow rate equal to the incoming flow rate. Material will be sent to downstream objects in a first-come-first-served manner.
- User Defined - The modeler has control over the input rate (both for the object and the individual ports) and the output rate for individual ports.
Input Ports
These properties affect how the object receives material from upstream objects:
- Maximum Flow Rate - The maximum rate that material will be allowed into this object through all input ports combined. This value serves as both the maximum input and maximum output rates. The actual rate is based on the amount of material available upstream and the space available in this object. Material will attempt to leave the Pipe at the same rate that it came in. If there is not enough room downstream, the material will "back up" and more (up to the maximum rate) will be available to send in the next tick.
- Maximum Port Rate - The maximum rate that material will be allowed into this object through any single input port.
- Input port scale factor - Each row of the table is the scale factor for a single input port. The value is multiplied by the maximum port rate to determine the actual maximum rate for that specific port. This allows the modeler to change the rate of individual output ports during a model run.
Output Ports
These properties affect how the object sends material to downstream objects:
- Maximum Port Rate - The maximum rate that material will leave this object through any one port.
- Output port scale factor - Each row of the table is the scale factor for a single output port. The value is multiplied by the maximum port rate to determine the actual maximum rate for that specific port. This allows the modeler to change the rate of individual output ports during a model run.
Adjust Input Rates
This function is called every tick and allows the user to change the input rates and scale factors during a model run. There are access variables that are references to the nodes that hold the rates and scale factors. To read the current rate (object or port) the getnodenum() command should be used. To change the rate the setnodenum() should be used. To read or change the scale factors, getnodenum() and setnodenum() should be used in conjunction with the rank() command.
Adjust Output Rates
This function is called every tick and allows the user to change the output rates and scale factors during a model run. There are access variables that are references to the nodes that hold the rates and scale factors. To read the current rate (object or port) the getnodenum() command should be used. To change the rate the setnodenum() should be used. To read or change the scale factors getnodenum() and setnodenum() should be used in conjunction with the rank() command.
The Layout Tab
The Layout tab has the following properties:
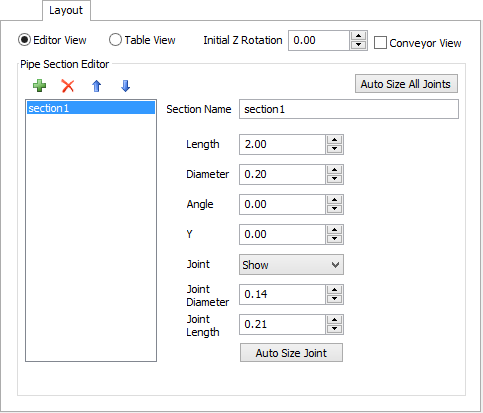
Editor View
Displays the Pipe Layout editor view as shown above.
Table View
Displays the Pipe Layout table view as shown below.
Initial Z Rotation
This is the rotation around the Z axis that is applied to the starting point of the Pipe. This is used to orient the Pipe in a particular direction before sections are drawn.
Conveyor View
If this box is checked, the Pipe will be drawn as a simple conveyor. This does not change the functionality of the pipe. See the Fluid Conveyor object for conveyor functionality.
Pipe Section Editor
| Icon | Description |
|---|---|
 |
Adds a new section to the table. |
 |
Removes the selected section from the table, or if no sensor is selected, removes the last sensor in the table. |


|
Moves the selected section up or down in the list. |
Additional properties in this group are as follows:
- Section Table - Each row in the table represents a single section of the Pipe. The columns are described above.
- Section Name - The name of the pipe section. This is purely for the modeler's convenience and has no affect on the model.
- Length - The length of the section
- Diameter - The diameter of this section of the Pipe. If the Pipe is being shown as a conveyor, this is the width of the end of the section. The actual section will become wider or more narrow depending on the diameter value of the previous section.
- Z Rotation - The rotation around the Z Axis that is applied at the end of the section.
- Y Rotation - The rotation around the Y Axis that is applied at the end of the section.
- Show Joint - Specifies whether the pipe's joint will be drawn between the end of this section and the start of the next one. This value is ignored if the Pipe is being drawn as a Conveyor.
- Join Diameter - Specifies the diameter of the joint.
- Joint Length - Specifies the length of the joint.
- Auto Size Joint - Automatically adjusts the joint size based on the diameter and rotation of the pipe sections.