Task 2.3 - Content Over Time Statistics Collector
Task Overview
In this tutorial we will look at how to collect data from a Process Flow activity, and how to create a time plot.
In this tutorial we will be creating a Statistic Collector that will collect data for the content of the Stations over time. This tutorial is based on the same model that was used in the Tutorial 1 of this series. For information on how to open the model, please refer to that tutorial:
Step 1 Setting up the Statistics Collector
In this step we will set up the statistics collector tool. To do this:
- Click on the Toolbox tab on the left of the screen and click the
 button to add a new tool. Navigate to the
Statistics section and select Statistics Collector.
This will open a properties window.
button to add a new tool. Navigate to the
Statistics section and select Statistics Collector.
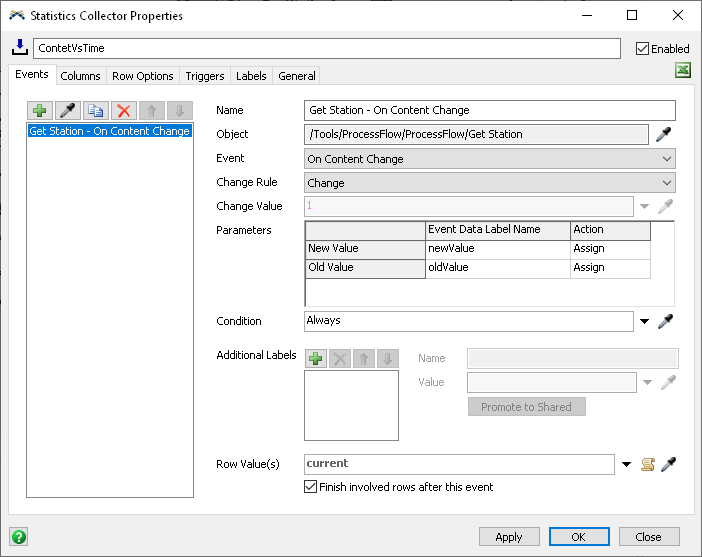
This will open a properties window. - Click on the field at the top and rename the statistics collector to ContentVsTime.
- With the Process Flow window open, go back to the
Statistics Collector properties window
on the Events tab. Click on the
 Sampler
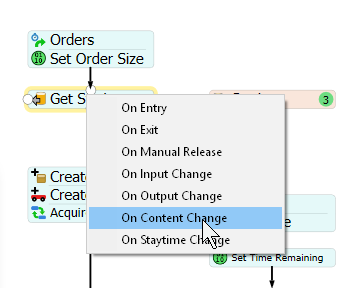
button below the tab, then navigate to the Process Flow activity called Get Station. From
the picklist that opens, select the option On Content Change.
Sampler
button below the tab, then navigate to the Process Flow activity called Get Station. From
the picklist that opens, select the option On Content Change. - Click the triangle next to the Row Value(s) and choose Event object (current).
- Finally, check the Finish involved rows after the event box.
- Click on the Columns tab.
- Click the button to add a new column to the
ContentVsTime collector.
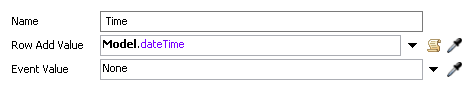
- In the Name field, rename this column to Time.
- Click the arrow next to the Row Add Value field select Time and then select Model Date/Time.
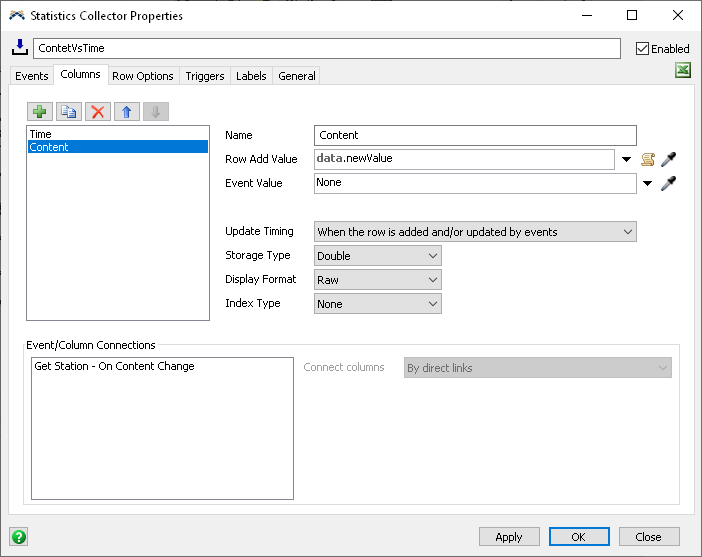
- Now click the button once again to add another column.
- In the Name field, rename this column to Content.
- In the Row Add Value field type data.newValue.
- Set the Storage Type property to Integer.
- Click the Apply button.
For this tutorial we are going to look at an event from an activity in the Process Flow tool that operates the logic of this model. Make sure the Process Flow window is open. You can find it by clicking on the Process Flow button at the top of the screen, navigate to the General section, and select Process Flow.
This activity is collecting tokens representing orders coming in and requesting a station to be packed in. By listening to the content change of tokens in this activity we are listening to the number of orders waiting to be packed.
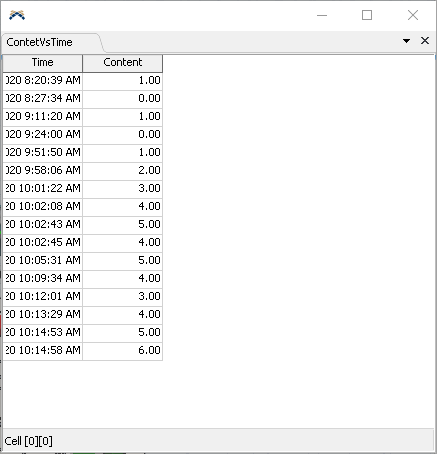
You can right click on the ContentVsTime collector in your tools and select the View Table option. If you reset and run the model now, you will see the table populate as the content of the Get Station activity changes. You may have to run the model for some time to see the results.
Explanation
Finishing a Row
In this task, you checked the Finish involved rows after this event box. This means that after the statistics collector has responded to the event (by possibly adding rows and/or updating columns), it will finish the row. Finishing the row means that the statistics collector will do three things:
- It will update any columns that update when they are accessed,
- It will disconnect the row in the table from the row value, and
- It will remove the row value from its list of row values.
Step 2 Creating a Chart
Now you will create a chart to show the change in the activity’s content over time. To do this:
- Click the Dashboards button at the top of the screen and select the Add a Dashboard option.
- In the Properties on the right, click on the field Dashboard Name. Rename the Dashboard to be ContentVsTime.
- While the dashboard view is active, navigate to the library on the left. Under the Base Chart Types section, find and drag a Time Plot chart onto the dashboard. This will open the new chart’s properties window.
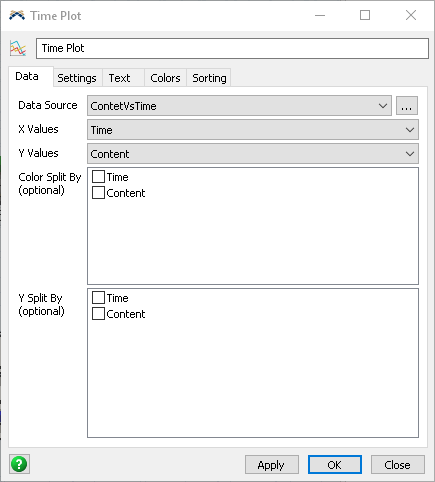
- Click on the Data Source field and select the ContentVsTime collector from the options.
- You will notice that the chart automatically will try to use the column values we created for the x and y axes of chart. We are going to leave the default values of Time as the X Values, and Content as the Y Values. If these fields did not set automatically make sure they are set accordingly now.
- Click on the Settings tab.
- Click on the Draw Style field and select the option Stair Step, instead of the default Points.
- Now click the Apply Button.

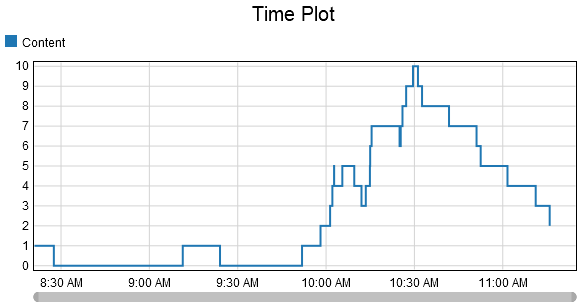
If you reset and run the model now, you will be able to see the chart show a time plot of our ContentVsTime collector. As before you may have to run the model for some time to see the results.
In the next task you will learn how to use a statistics collector to record the total content of many process flow activities.