Tutorial 2 - The Statistics Collector
This tutorial will provide an overview of the main features and capabilities of the Statistics Collector. You'll learn how to use the Statistics Collector to listen to events and set up data tables. You'll also learn how to create charts that can better visualize the data from the Statistics Collector.
When you're finished with this tutorial you will have learned how to generate a number of data tables:
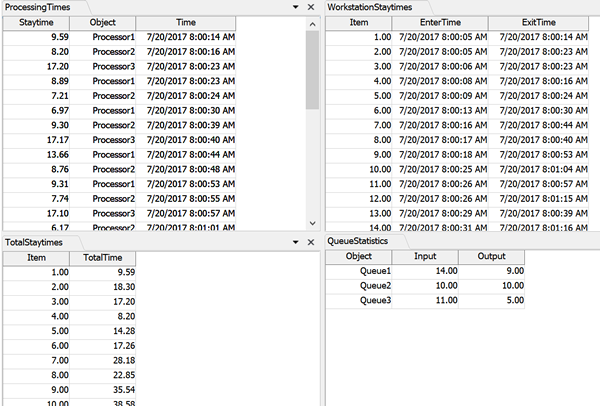
You'll also learn how to create a variety of charts to visualize this data:
Tasks Covered
This tutorial will cover the following tasks:
Build a Basic Statistics Collector
In this task, you'll get introduced to the basic features and functionality of statistics collectors. You'll specifically learn how to add events to a collector and how to set up a data table. You'll also learn how to link a statistics collector to a chart to visualize the data it records during a simulation run.
Get Data from Multiple Objects
In this task, you'll learn how you can use a statistics collector to compare data from multiple objects. You'll learn how to get a collector to distinguish between the data it records from different objects. You'll also learn how to listen to groups of objects. Then you'll learn how you can compare and contrast data from multiple objects in both a histogram and a timeplot chart.
Create and Track Custom Statistics
In this tutorial task, you'll learn how to create custom statistics using a statistics collector. You'll also learn how you can transform data from a statistics collector using a calculated table. Then you'll learn how to create data tables and charts that will display the current content statistics from a group of objects.
For More Information
These tasks will cover the topics included in the chapter entitled Getting Data from Your Model.