FlexScript Code Profile
Overview and Key Concepts
The FlexScript Code Profile window analyzes the FlexScript code being executed in your model.
You can access the FlexScript Code Profile from the Debug menu on the main toolbar.
Properties
The FlexScript Code Profile has the following properties:
Enable Flexscript Code Profiling
Check this box to enable Code Profiling. Code profiling will remain enabled even if the Code Profile window is closed.
Reset Code Profile Data
Clears the currently accumulated profile data.
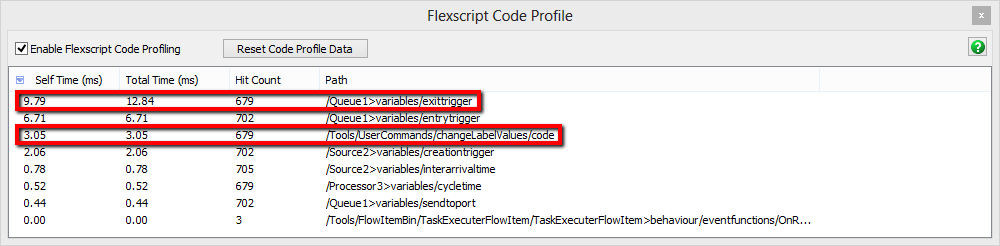
Self Time (ms)
This is the total amount of time in milliseconds that the code has taken to execute since the profiling began.
Total Time (ms)
This is the Self Time plus any time spent calling other functions like User Commands within the code.
In most cases the Self Time and Total Time will be equal. However, you'll notice above that the Self Time and Total Time of the Queue1>variables/exittrigger are different. Within the exit trigger, a user command called changeLabelValues is called. The Total Time of the Queue's exit trigger is equal to its Self Time + changeLabelValue's Self Time.
Hit Count
This is the total number of times the code has been executed.
Path
The path to the FlexScript node being executed.