State Pie Template
Overview and Key Concepts
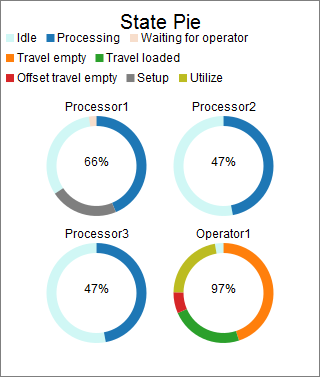
This chart template creates a pie chart, and calculates utilization based on each object's time in various states. Each segment of the pie chart represents the proportion of time spent in one of the object's states.
The Options Tab
The Options tab has the following properties:
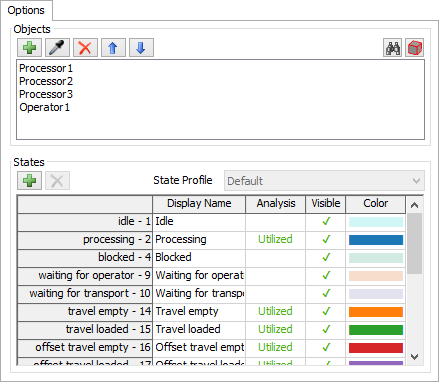
- Objects - Specifies the objects to include on the chart. See Adding Objects for more information.
- States - This table updates when objects are added. Each row of the table
allows you to edit the following attributes:
- Display Name - Specifies the name of the state, as seen on the chart. You can edit this field by double clicking on the cell and typing a new name.
- Analysis - Specifies how this state influences the utilization statistic, calculated by this template.
You can edit this value by clicking on the cell. This will rotate through three possible values:
(blank) - Indicates that time spent in this state should be considered "not utilized"
Utilized - Indicates that time spent in this state should be considered "utilized"
Excluded - Indicates that time spent in this state should be excluded from the utilization calculation. - Visible - Specifies whether the state will appear on the chart. You can edit this value by clicking on the cell, which will toggle whether the state is visible.
- Color - Specfies what color the state should have. You can edit this value by clicking on the cell, which will allow you to pick a new color for this state.
 button.
States may be removed from the table using the
button.
States may be removed from the table using the  button.
If all included objects share an additional state profile, you can create a chart of that profile using the
State Profile property. By default, utilized states are shown before non-utilized states.
Also by default, non-utilized state colors are transparent.
button.
If all included objects share an additional state profile, you can create a chart of that profile using the
State Profile property. By default, utilized states are shown before non-utilized states.
Also by default, non-utilized state colors are transparent.
- Object Display - Specifies the text to display before each object's name.
- Utilization Display - Specifies the text to display in the center of each pie, before the utilization value.
The Settings Tab
The Settings tab is identical to the Pie Settings tab. For more information, see Pie Settings.
The Colors Tab
The Colors tab is identical to the Pie Colors tab. For more information, see Pie Colors.
The Advanced Tab
This template, like all templates, uses the Advanced Tab. For more information, see Advanced Tab.