People Templates
Overview and Key Concepts
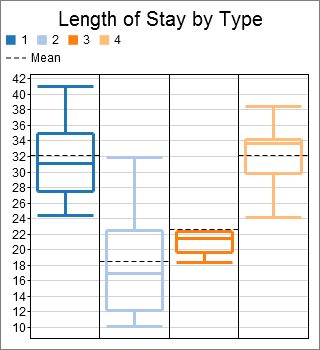
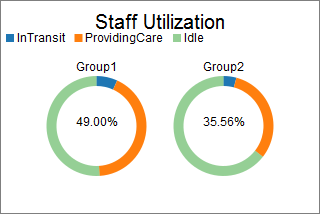
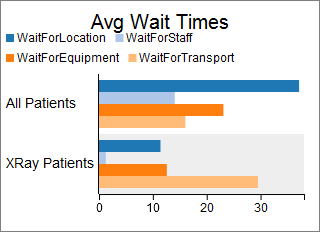
People Templates provide a quick and easy way to create charts for People-based models. You can use People Templates to display data from a People Statistics Table in an intuitive way. The following charts are a few examples of the available templates:
All People Templates are a special kind of Chart Template, in that they use standard FlexSim tools to gather the desired data. They are special because they consist solely of a Calculated Table that is configured to query one or more People Statistics Tables.
People Templates provide very general data by default, such as average data for all Person flowitems. However, you will likely need get more specific data. The previous example charts show specific data, rather than the default general data. The first categorizes the original data by type. The second and third show examples of creating and comparing multiple subsets of the original data.
In order to create these kind of specific charts, all People Templates expose the Subsets and Partitions tabs of the Query Builder interface for the internal Calculated Table. Subsets allow you to create subsets of the original data, and Partitions allow you to categorize the data.
The Tables/Metrics Tab
All People Templates have a Tables/Metrics tab. This tab has two purposes:
- You can see which the template depends on, and
- You can view and edit any options the template provides about the metric.
A typical Tables/Metrics tab has the following properties:
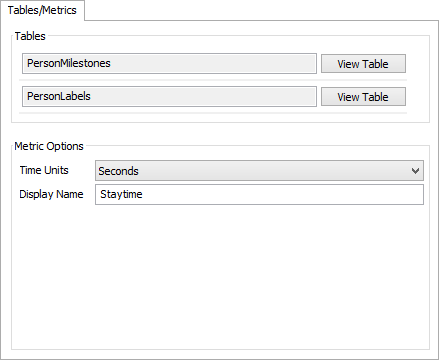
Tables
The Tables group box shows a list of the tables this template depends on. The first table in the list contains the data required for the metric. Any additional tables contain data that may be useful for creating Subsets or Partitions.
Next to each table in the list, there is a View Table button. Click this button to open the properties window for that table. This view will allow you to see the data recorded in each table. For more information, see the People Statistics Table Properties topic.
Metric Options
The Metric Options group box will contain any options about the metric used by the current template. Most templates allow you to edit the Display Name of the metric, which appears in various locations on the chart. In addition, metrics involving durations will usually have a Time Units property, allowing you to change the units of the metric. Similarly, metrics involving distances will usually have a Units property that allows you to change the distance units. Other templates may have more specific properties, depending on the metric being gathered. Those properties are documented with each particular template.
The Subsets Tab
All People Templates have a Subsets tab. It is identical to the Subsets tab on the Calculated Table, with one exception: some People Templates will not allow you to make Subsets, if you have a certain number of partitions. Details about this exception are documented with each particular template.
For information on the properties on this tab, see the Calculated Table Subsets topic.
The Partitions/Sorting Tab
All People Templates have a Partitions/Sorting Tab. The Partitions group box allows you to specify how data should be categorized. It is identical to the Partitions group box on the Calculated Table, with one exception: some templates will limit the number of Partitions you can have. Details about this exception are documented with each particular template.
The Sorting area displays a messaged, based on whether or not this particular template will sort its results.
For information on the properties on this tab, see the Calculated Table Partitions topic.
The Advanced Tab
Since People Templates are a special kind of Chart Template, they also have the Advanced tab. For more information, see the Chart Templates topic.