Throughput per Hour vs Time Template
Overview and Key Concepts
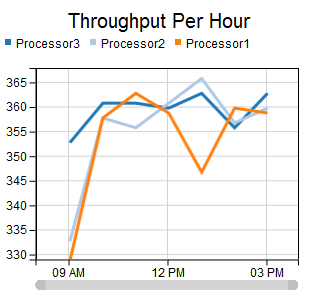
This template creates a line graph. Each included object is displayed with its own color. The line shows the throughput (usually output) of each object in the previous hour.
For more information about Throughput templates, see Throughput Templates.
The Options Tab
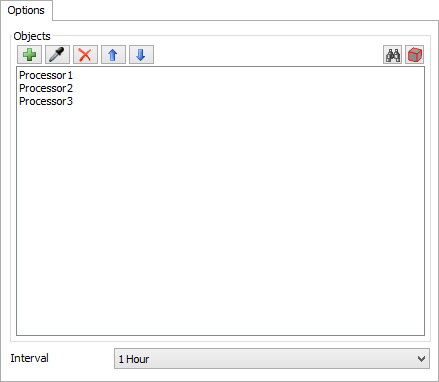
The Options tab has the following properties:
- Objects - Specifies the objects to include on the chart. See Adding Objects for more information.
- Interval - Specifies the time interval for the chart. The line will show the total output for the previous interval.
The Settings Tab
The Settings tab is identical to the Time Plot Settings tab. For more information, see Time Plot Settings.
The Colors Tab
The Colors tab is identical to the Time Plot Colors tab. For more information, see Time Plot Colors.
The Advanced Tab
This template, like all templates, uses the Advanced Tab. For more information, see Advanced Tab.