Staytime per Hour vs Time
Overview and Key Concepts
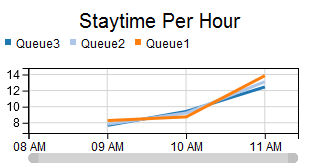
This template creates a line graph. Each object is connected with a unique line. Each line shows the average staytime for the previous hour, every hour, for that object.
For more information about Staytime templates, see Staytime Templates.
The Options Tab
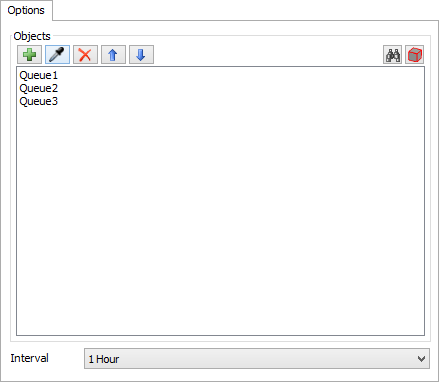
The Options tab has the following properties:
- Objects - Specifies the objects to include on the chart. See Adding Objects for more information.
- Interval - Sets the interval for the template. All staytime values are recorded during each interval. The template then computes the average of those staytimes.
The Settings Tab
The Settings tab is identical to the Time Plot Settings tab. For more information, see Time Plot Settings.
The Colors Tab
The Colors tab is identical to the Time Plot Colors tab. For more information, see Time Plot Colors.
The Advanced Tab
This template, like all templates, uses the Advanced Tab. For more information, see Advanced Tab.