Viewing Standard Statistics
Introduction to Standard Statistics
Nearly all 3D objects and process flow activities automatically collect a standard set of statistics while a simulation model runs. See Key Concepts About Getting Data for a more detailed explanation of the different categories of standard statistics that are available in FlexSim.
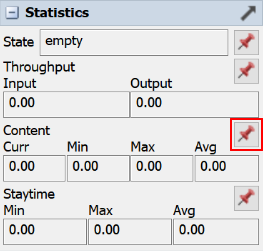
You might have noticed in Quick Properties that the default statistics have pin buttons
 next to them. You can use the pin button to
pin a specific default statistic that you're interested in to a dashboard. There are several
advantages to pinning a statistic to a dashboard:
next to them. You can use the pin button to
pin a specific default statistic that you're interested in to a dashboard. There are several
advantages to pinning a statistic to a dashboard:
- Focusing on Your Key Metrics - You likely won't be interested in every one of the default statistics that are available. You can pin the specific statistics you're interested in to the dashboard and ignore the statistics you're not interested in.
- Consolidating Statistics - You will probably be interested in statistics from more than one object. However, you can only view one object in Quick Properties at a time. While you could possibly open several statistics windows, that might clutter up your workspace. It's much easier to pin statistics from all the objects you're interested in to a single dashboard that you can view during a simulation run.
- Automatically Generating Statistics Collectors - When you pin a default statistic to a dashboard, it automatically generates a statistics collector for this statistic. These auto-generated statistics collector can cut down on the time it takes to create a collector for the statistics you're interested in. It's also a good way to explore and learn more about how statistics collectors work. You can also combine elements from one auto-generated collector with elements from another collector to compare data from multiple objects.
- Create Charts - Once a statistic has been pinned to a chart and you've auto-generated a collector, you can create charts to better visualize the statistics you're interested in. By default, many statistics are simply displayed as raw data in a table, but you can easily use a different kind of chart to visualize your data.
This topic will explain how to view standard statistics on 3D objects or process flow activities and other related topics.
Viewing 3D Object Statistics
To view the standard statistics for a 3D object:
- In the 3D model, click a 3D object to select it.
- In Quick Properties, click the Expand button
 next to the
Statistics group.
next to the
Statistics group. - Reset and run the model to watch the statistics update in real time.
You can also set your model view settings to automatically show 3D object statistics while a simulation model runs:
- Click a blank space in the 3D model to ensure nothing is currently selected.
- In Quick Properties, click the Show Names and select Show Names and Stats from the menu.
Viewing Process Flow Activity Statistics
To view the standard statistics for a process flow activity:
- In a process flow, click an activity to select it.
- In Quick Properties, click the Statistics button
 next to the activity's name to open
the statistics window.
next to the activity's name to open
the statistics window. - Reset and run the model to watch the statistics update in real time.
Pinning Statistics to a Dashboard
You might have noticed in Quick Properties that the standard statistics have pin buttons
next to them. You can use the pin button to
pin a specific standard statistic that you're interested in to a dashboard. See
Pinning Statistics to a Dashboard for a more thorough explanation of
why you might want to pin a statistic to a dashboard.
To pin a statistic to a dashboard:
- Find the statistic in which you are interested. (See Viewing 3D Object Statistics and Viewing Process Flow Activity Statistics.)
- Next to the statistic in which you are interested, click the
Pin button
to open a menu.
- Point to or select the name of the dashboard that you want to pin the statistic to. If you haven't created a dashboard yet, point to Pin to New Dashboard.
- Confirm the following:
- The statistic you selected should be added as a new chart on the dashboard you selected.
- In the Toolbox under the Statistics Collector group, you should see a new statistics collector for the statistic that you pinned.