Troubleshooting Process Flows
Introduction to Troubleshooting Process Flows
One of the main advantages of using the Process Flow tool is that it is much easier to debug and troubleshoot than code. That's because you can visually see the logic of your simulation model in a process flow. This topic will discuss various tools and strategies you can use to troubleshoot your process flow.
Using the Step Button
One of the best places to start when troubleshooting in process flow is to observe each step in the process flow. You can observe each step in process flow the same way you would observe it in a normal simulation model, using the Step button on the simulation control bar:
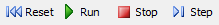
Instead of clicking the Run button, you can click the Step button to advance the simulation to the next event that will occur in the process flow model. You'll then be able to notice which tokens cause error messages or fail to do what you expected them to do.
You can also click on a specific token to look at detailed information about its properties. See Token Properties for more information about how to view a token's properties.
Sometimes if your process flow has many different tokens, it might be difficult to track a specific token through each step of the process flow. You can solve this problem by tracing a token. See Tracing Tokens Visually and Tracing Tokens Using a Tracing History for more information.
Tracing Tokens Visually
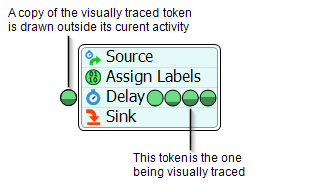
You can visually trace a token as it moves through the process flow if needed. When a token is being visually traced, a copy of the token will appear outside the process flow so that you can easily track one specific token as it moves through the process flow.
To turn on visual tracing directly from the process flow:
- Click the token you want to trace to select it.
- In Quick Properties, check the Visually Trace Token checkbox. See Token Properties for more information.
To view a high-level overview of all the current tokens and select one to trace:
- Click a blank space in the process flow to ensure nothing is selected.
- In Quick Properties, click the View Tokens button to open the Tokens window.
- Look at the Tokens list to view the names or IDs of all the tokens that are currently in the process flow. Clicking on any token will show you its detailed information. After you've determined which token you want to visually trace, make sure it is still selected in the Tokens list.
- Near the bottom of the window check the Visually Trace Token checkbox. See Tokens Window for more information.
Tracing Tokens Using a Tracing History
It's possible to get a pretty detailed view of a token's history as it moves through a process flow. To set up the ability to view a tracing history, you need to first turn on the ability to trace history. Then you can view the trace history in a variety of ways.
Turning on the Trace History Ability
To turn on the trace history, you first need to decide which activity in the process flow will be the beginning of the trace history and which activity will be the end. For example, if you wanted to trace an entire process flow, you'd probably begin tracing on the Source activity at the beginning of the process flow, then tracing will automatically end when a token is sent to a Sink or Finish. You can turn tracing on and off at any activity.
To set up the trace history:
- Click a blank space in the process flow to ensure nothing is selected.
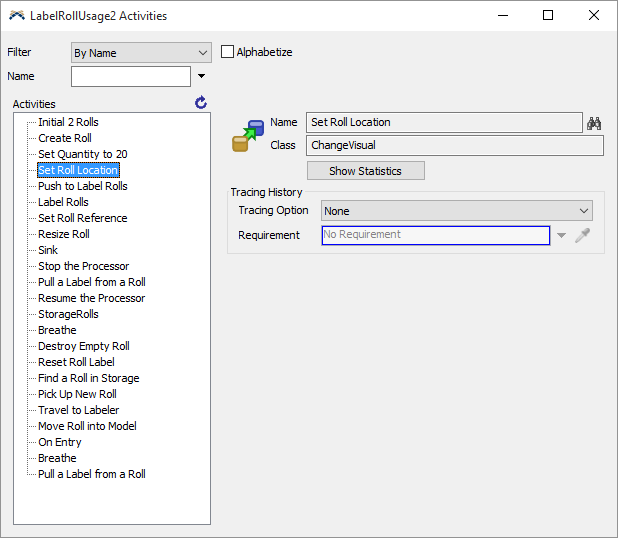
- In Quick Properties, click the View Activities button to open the Activities window.
- Look at the Activities list to view the names of all the activities that are currently in the process flow. After you've determined which activity will be the beginning of the trace history, make sure it is still selected in the Activities list.
- In the Tracing History group, click the Tracing Option menu and select Begin Tracing. NOTE: If you'd like to use a specific set of criteria to restrict the tokens that are traced, you can use the Requirement box to determine the criteria.
- Now select the activity that will be the end of the tracing history in the Activities list.
- In the Tracing History group, click the Tracing Option menu and select End Tracing. See the Activities Window for more information.
Alternatively, you can right-click any activity in a process flow to open a menu. Point to Tracing History, then select Begin Tracing or End Tracing to turn tracing on or off.
Viewing a Trace History
To view a trace history:
- Click a blank space in the process flow to ensure nothing is selected.
- In Quick Properties, click the View Tokens button to open the Tokens window.
- Look at the Tokens list to view the names or IDs of all the tokens that are currently in the process flow. Clicking on any token will show you its detailed information. After you've determined which token for which you want to view the trace history, make sure it is still selected in the Tokens list.
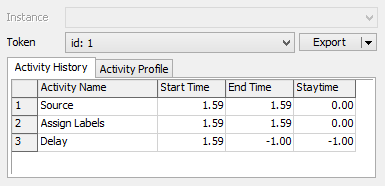
- Near the bottom of the window, click the Show Trace History button to bring up the Trace History window, an example of which is shown in the following image:
You can also click the Show Trace Histories button below the list of tokens to open a Trace History window and then select the desired token from the drop down.
You can also view a token's trace history by clicking on it in the process flow view and clicking the Trace History button in Quick Properties.
When a Trace History window is open, the process flow view will display that token's history out to the left of each activity that it entered in the form id.index. Where id is the token id number and the index corresponds to the index in the tracing history data.
The Trace History window displays two sets of information, the Activity History and the Activity Profile.
- Activity History - This displays the order in which the token moved through the process flow as well as the times in which it entered and exited each activity.
- Activity Profile - This displays the total amount of time the token spent inside each activity. If your process flow contains any kind of loop or tokens go through the same activities multiple times throughout their life, this data will show you how long the token is spending in each of these activities.
Using 0 Second Delays
Some problems in a model may occur because of synchronous execution of activities that are triggered by some event in the model. For example, you might have multiple flow items on a fixed resource such as a conveyor. If your process flow uses an event-listening activity such as an Event-Triggered Source or Wait for Event to determine when to release a flow item, it's possible that the conveyor might accidentally release all the items on the conveyor at once.
This problem is the result of how FlexSim handles the logistics of event-listening activities. (See Key Concepts About Event-Listening for more information.) It often happens when a Wait For Event or Event-Triggered Source is listening for a specific event. Then, when that event occurs, the event may be followed by one or more other activities that may also inadvertently cause events in the model to fire, without any delays between the original triggered event and the subsequent event-triggering logic. The logic happens so fast that it doesn't give the original event enough time to "breathe" and finish what it was doing. The kind of events that might be affected by these problems are:
- Opening inputs or output ports
- Receiving or releasing items
- Moving objects
- Destroying objects, etc.
In these cases, you can fix the problem by adding a Delay activity after the event-listening activity and setting the delay time for 0 seconds. Adding this activity will allow the original triggering event to finish what it was doing before the token moves on. (See Delay for more information about this activity.)
Another advantage of using 0 second delays is that by doing that it makes it easier to debug using the Step button. (See Using the Step Button for more information.) When activities are triggered by external events, process flows must force all activity execution to happen synchronously, because you may actually want to do calculations, define return values, etc. immediately before anything else happens. So unless you explicitly instruct it otherwise by adding a Delay activity with a 0 delay time, event-triggered activities will execute synchronously. This delay will allow the object that triggered the event to finish its event logic.
Token Properties
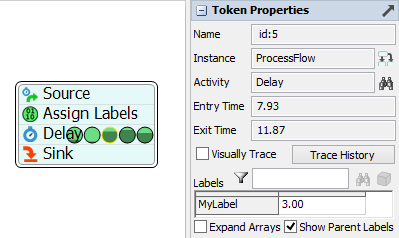
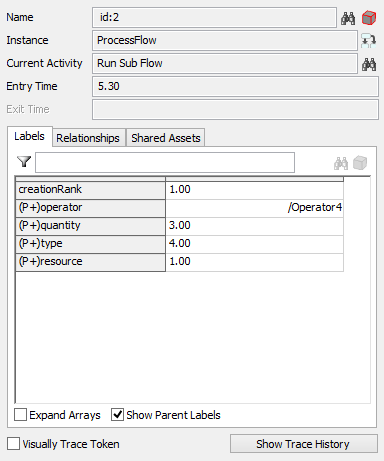
The Token Properties are especially useful for understanding exactly what is happening to a particular token because it gives detailed information about the token. During a simulation run, you can press the Stop button pause a simulation. Then, when you click on a specific token, the Quick Properties pane will show the Token Properties, as shown in the following image:
This pane has the following settings:
- Name - Displays the token's name (if the token was assigned one) and id number.
- Instance - Displays the specific instance of the process flow that this token is in. See Process Flow Instances for more information about instances.
- Activity - Displays the current activity the token is in.
- Entry Time - Displays the time on the simulation clock when the token entered the current activity.
- Exit Time - If applicable, displays the time on the simulation clock when the token will exit the current activity. Applicable activities include the Delay, Task Sequence Delay and Run Animation.
- Visually Trace - If you check this checkbox, the token will be drawn to the left of its current activity as it moves through the process flow. See Tracing Tokens Visually for more information.
- Trace History - Displays the trace history for this token. See Tracing Tokens Using a Tracing History for more information.
- Labels - Displays all of the token's labels and their current values in the form of a table.
 - This field allows you to filter
the list of labels by label name.
- This field allows you to filter
the list of labels by label name. - If the selected label in the
token's label table is an object or another token, this will center that
object/token in its view.
- If the selected label in the
token's label table is an object or another token, this will center that
object/token in its view. - If the selected label in the
token's label table is an object or another token, this will select the
object/token.
- If the selected label in the
token's label table is an object or another token, this will select the
object/token.- Expand Arrays - Affects the way labels are displayed in the table. If checked, any label that contains array data will display each entry in the array as a separate row.
- Show Parent Labels - Affects the way labels are displayed in the table. If checked, any labels owned by a parent ancestor tokens will be displayed in the table.
Token Relationships
If the selected token is a child or has children, the Relationships pane will also be displayed:
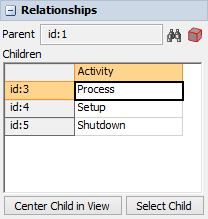
The pane has the following settings:
- Parent - If the token has a parent, the name and id number of the parent token will be displayed here.
- - This will center the parent token
in the process flow view.
- - This will select the token,
changing the quick properties to display the parent token's properties.
- Children - If the token has any children, they will be displayed in this table. The name and id number will be displayed in the first column and the current activity of the child token will be displayed in the Activity column.
- Center Child in View - This will center the selected child token in the process flow view.
- Select Child - This will select the child token, changing the quick properties to display the child token's properties.
Token Shared Assets
If the selected token has allocated any shared assets (acquired a resource, pushed/pulled from a list or entered a zone), the Shared Assets pane will also be displayed:
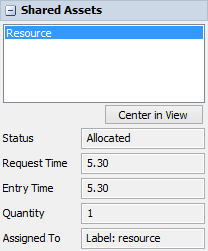
The pane has the following settings:
- Allocated List - A list of all allocated shared assets will be displayed here, by name.
- Center in View - This will center the selected shared asset in the process flow view.
- Status - Displays the status of the allocation. The following statuses are possible:
- Requested - The token has attempted to allocated the shared asset but it is not currently available. The token is waiting for the shared asset to become available.
- Allocated - The token has successfully allocated a shared asset.
- Request Time - The simulation time the token attempted to allocate the shared asset.
- Entry Time - The simulation time the token allocated the shared asset.
- Quantity - Only used with Resources. This is the number of requested/allocated resources.
- Assigned To - Only used with Resources. This is the label that the resource was assigned to.
Token Properties Window
All of the above properties can also be opened in the Token Properties Window which is available either through the Pop-out button on the Token Properties pane in the quick properties, or by double clicking a token in the process flow view.
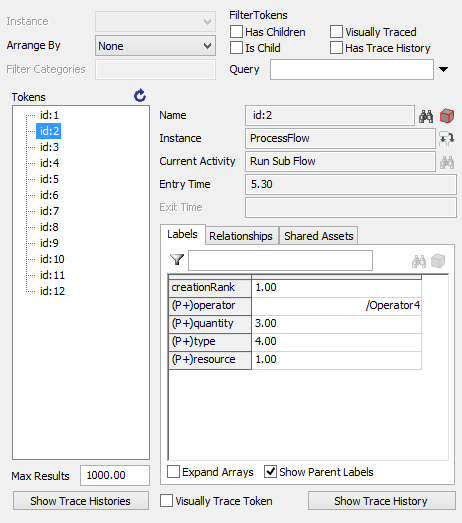
Tokens Window
The Tokens window allows you to view, edit, and manage of all the tokens that are currently in your process flow. You can open this window by clicking a blank space in your process flow (to make sure nothing else is selected). Then, in Quick Properties, click the View Tokens button to open the window.
Activities Window
The Activities window allows you to view, edit, and manage all the activities that are currently in your process flow. You can open this window by clicking a blank space in your process flow (to make sure nothing else is selected). Then, in Quick Properties, click the View Activities button to open this window.
Lists
If your Process Flow involves any interaction with Lists, you will probably need to check the entries on that List. You can view those entries and any back orders by clicking the View Entries button or View Back Orders button on the List Properties.