Throughput per Hour by Type vs Time Template
Overview and Key Concepts
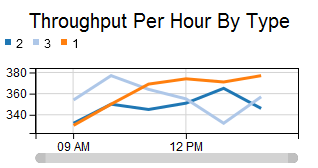
This composite template creates a time plot, with one colored line per type value. The line shows the throughput for that type from the previous hour, every hour. For more information about Throughput templates, see Throughput Templates.
The Options Tab
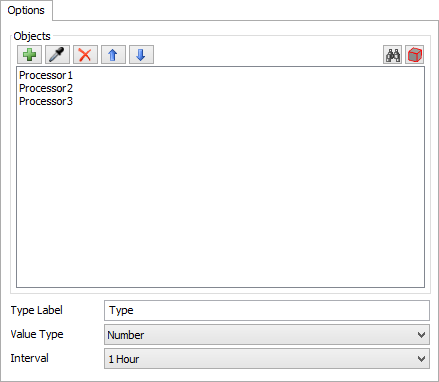
The Options tab has the following properties:
- Objects - Specifies the objects to include on the chart. See Adding Objects for more information.
- Type Label, Value Type - These properties are common to all By Type templates. For more information, see By Type Templates.
- Interval - Sets the interval for the template. For more information, see Throughput per Hour Table.
The Settings Tab
The Settings tab is identical to the Time Plot Settings tab. For more information, see Time Plot Settings.
The Colors Tab
The Colors tab is identical to the Time Plot colors tab. For more information, see Time Plot Colors.
The Advanced Tab
This template, like all templates, uses the Advanced Tab. For more information, see Advanced Tab.