Task 2.9 - Output By Hour By Type
Task Overview
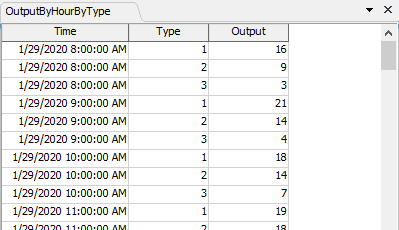
In this task, you will create a Statistics Collector that records the total output of each type for each hour:
This task is based on the same model that was used in the Task 1 of this series. For information on how to open the model, please refer to that task:
Step 1 Add Events to the Statistics Collector
In this step you will add events to the statistics collector. To do this:
- Click on the Toolbox tab on the left of the screen and click the
 button to add a new tool. Navigate to the
Statistics section and select Statistics Collector.
This will open a properties window.
button to add a new tool. Navigate to the
Statistics section and select Statistics Collector.
This will open a properties window. - Click on the field at the top and rename the statistics collector to OutputByHourByType.
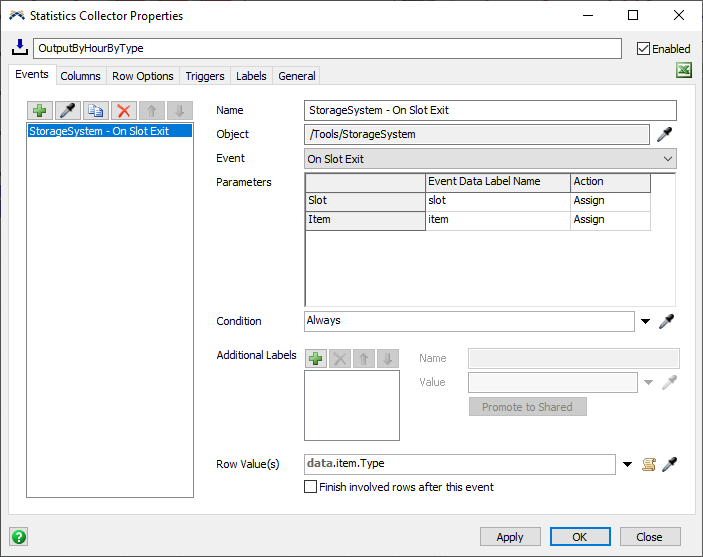
- On the Events tab, click on the Sampler button. Then click on the Storage System in the Toolbox. Choose the On Slot Exit option.
- In the Additional Labels field, click the
button and select
Add label for this event.... Set the Name of this
label to Delta and set its Value to
1. We'll use this label in a later step. - In the Row Value(s) field, type the following code:
data.item.Type - Click the plus button
in the top left of the Events tab.
Choose the Create a timer event event
option.
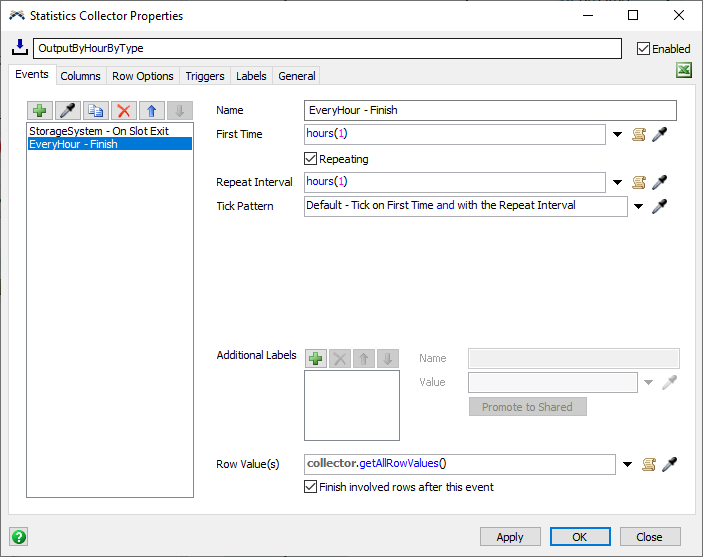
- Set the Name of this event to Every Hour - Finish.
- Click the triangle button next to the First Time property and choose the 1 Hour option.
- Click the triangle button next to the Repeat Interval property and choose the Every Hour option.
- In the Additional Labels field, click the
button and select
Add label for this event.... Set the Name of this
label to Delta and set its Value to
0. - In the Row Value(s) field,
write the following code:
collector.getAllRowValues() - Check the Finish involved rows after the event box.
- Click the plus button
in the top left of the Events tab.
Choose the Create a timer event event
option.
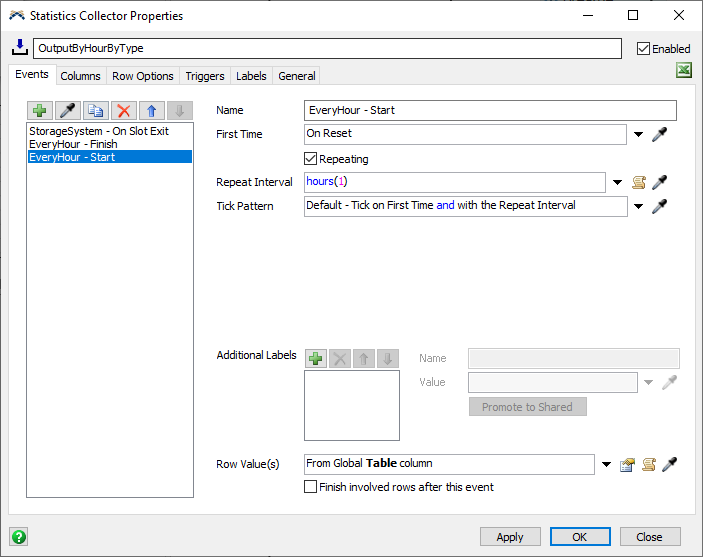
- Set the Name of this event to Every Hour - Start.
- Click the arrow next to the First Time property and choose On Reset.
- Click the triangle button next to the Repeat Interval property and choose the Every Hour option.
- In the Additional Labels field, click the
button and select
Add label for this event.... Set the Name of this
label to Delta and set its Value to
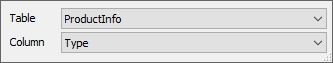
0. - Click the triangle button next to the Row Value(s) property and choose From Global Table column.
- In the popup, be sure the Table property is set to ProductInfo.
- Set the Column property to Type.
- Click outside the popup to close it.
Explanation
In this step, you listened to three events:
- The Storage System's On Slot Exit event,
- A timer event that fires after an hour, and then every hour, and
- A timer event that fires when the model is reset, and then every hour.
The row value for the first event is a single value- the Type of the item that exited the storage system. The row value for the second is the set of all row values that are currently active in the statistics collector. The row value for the third event is all values in the Info column of the ProductInfo table. No matter which event fires, each row value is a valid Type.
Each of these events has a specific purpose. The On Slot Exit event will allow the statistics collector to increment a label associated with that type. The first timer event will allow the statistics collector to display the total for the given hour and, and to finish the row. The third event will restart the entire process for the next hour.
Step 2 Add Columns to the Statistics Collector
In this step, you will add columns to the Statistics Collector. To do this:
- Click on the Columns tab.
- Click the button
and choose Add column.
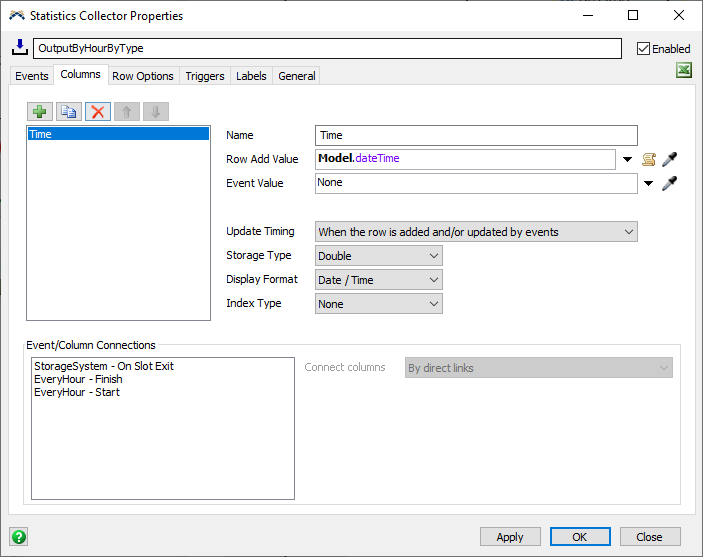
- Set the column's Name to Time.
- Click the arrow next to the Row Add Value field select Time and then select Model Date/Time.
- Click the button once again
and choose Add column.
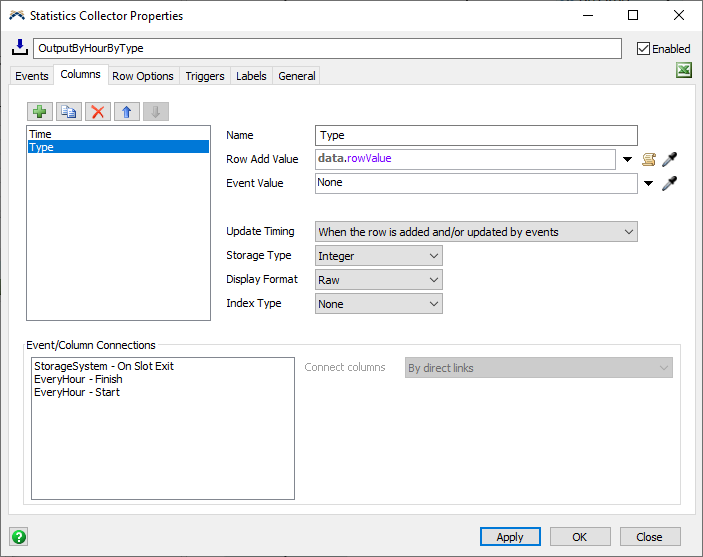
- In the Name field, rename this column to Type.
- Click the arrow next to the Row Add Value field, point to Data, and choose Row Value.
- Set the Storage Type property to Integer.
- Click the button once again
and choose Add column.
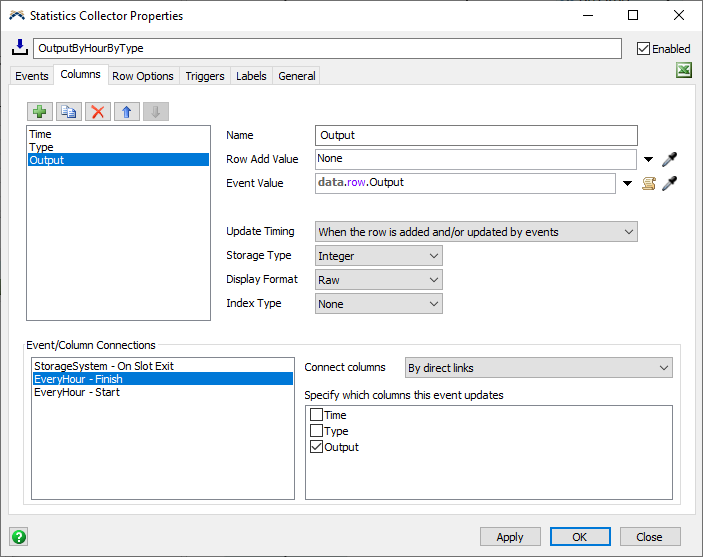
- In the Name field, rename this column to Output.
- Set the Event Value field to
data.row.Output. - Set the Storage Type property to Integer.
- In the Event/Column Connections area, select the EveryHour - Finish event and check the Output box to connect this event to the Output column.
Explanation
In this step, you added three columns: Time, Type, and Output. The Time
and Type columns are straightforward; at the beginning of each hour, these
two columns will record the current time and the Type associated with each
row. The third column doesn't record a value when the row is added. Instead,
it waits for the EveryHour - Finish event. When that event happens,
this column will record the value of Output, a row label on the
data entity.
The only remaining task is to make sure that the Output label has the correct data, which you will do in the next step.
Step 3 Add Triggers to the Statistics Collector
In this step, you will add triggers to the Statistics Collector. To do this:
- Click on the Triggers tab.
- Click the plus button
and choose On Row Updating.
- Click the plus button
in the On Row Updating trigger and choose
Increment row label.
- In the popup, set the Increment
field to
"Output". Set the amount to increment by todata.Delta. - Click the Apply button.
You can right click on the OutputByHourByType collector in the Toolbox and select the View Table option. If you reset and run the model, you will see the table record the output by type each hour. You may wish to run the model as fast as possible to see the data populate.
Explanation
When the model is reset, the EveryHour - Start event fires. It yields an array of Type values, gathered from the ProductInfo table. This adds one row per Type value to the table. The Time and Type columns are filled in, but the Output column is left blank.
When an item exits inventory, the statistics collector determines its Type. Because there is already a row for that type, and because the On Slot Exit event is not connected to any columns, the table doesn't change. However, the On Row Updating event fires for the Type's row. In this trigger, you added code that increments a row label called Output. In this way, you are counting the number of outputs of a given type.
Each hour, both timer events fire. The EveryHour - Finish event fires first, because it is higher in the list. This event yields all current row values as its row value, so it will update all three active rows. This event is connected to the Output column, so this column finally records the Output row label. Then this event finishes the row, so the row value is forgotten and the row labels are destroyed.
Finally, the EveryHour - Start event fires again. Once again, it yields all Type values from the ProductInfo table. Since the statistics collector has forgotten these values, it adds one more row per type, and starts the whole process over again.
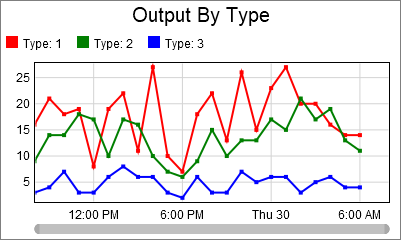
Step 4 Creating a Chart
Now you will create a chart to show the data in the statistics collector as a time plot. To do this:
- Click the Dashboards button at the top of the screen and select the Add a Dashboard option.
- While the dashboard view is active, navigate to the library on the left. Under the Base Chart Types section, find and drag a Time Plot chart onto the dashboard. This will open the new chart’s properties window.
- Click on the Data Source field and select the OutputByHourByType collector from the options.
- Set the X Values property to the Time column.
- Set the Y Values property to the Output column.
- Check the Type box in the Color Split By list.
- On the Settings, change the Draw Style property to Lines and Points.
- Click on the Text tab.
- Check the Custom Title box, and set the custom title to Output By Type.
- In the Show Column Headers area, check the Type box.
- Click on the Colors tab.
- Click the Edit Values button, and choose Remove all colors.
- Click the plus button
three times to add three colors.
- Click off of the Quick Property panel to apply the changes.
If you reset and run the model now, you will be able to see the chart show a time plot of your OutputByHourByType collector. As before you may have to run the model for some time to see the results.