Task 2.1 - Build an Average Content Collector
Task Overview
For this task, we will be using a model that came with your installation of FlexSim. You can find the model file in your Documents, in the FlexSim 2021 Projects/tutorials/FlexSim21.0 folder. This model is a simple packing and shipping facility. Orders for pallets of shipment come in. Operators then pack the pallets accordingly in each of the three stations, and then the pallets are shipped out.
In this tutorial task, you'll get introduced to the basic setup of a statistics collector, and a basic look at some of the features in the Statistics Collector tool. When you are finished with the tutorial, you should have a custom statistics collector that will gather data in a table.
You'll also learn how to link dashboard charts to a statistics collector's data table to visualize the data.
Step 1 Opening and saving the model with a new name
In this step, you'll open the model that serves as the starting point for all tasks in this tutorial. Then you'll save it with a new name in a different directory.
- In the main toolbar, click the
 open button to open the
model open dialog.
open button to open the
model open dialog. - Navigate to your Documents folder, then to the FlexSim 2020 Projects folder.
- From there, navigate to the tutorials folder, then to the FlexSim20.1 folder.
- Open the model called StatisticsCollectorTutorialModel.fsm.
- In the main menu, open the File menu, and choose Save Model As... to open the model save dialog.
- Navigate to the FlexSim 2020 Projects folder in your Documents folder.
- Save the file as StatsCollectorTutorialModified.fsm.
You only need to do this step once for all of the tasks in this tutorial. If you want to do the tutorials again, you can always save a new copy of the installed tutorial model.
Step 2 Creating a Basic Statistics Collector
In this step you'll create and setup a basic statistics collector. You'll be telling it what events to listen to, and what data to gather as a result.
To set up the statistics collector:
- Click on the Toolbox tab on the left side of the screen.
- Click the
 button to bring up the picklist options, and add a new tool.
 - Select the Statistics option, and then the Statistics Collector option to create a new statistics collector tool. This will automatically open the properties window for the newly created statistics collector.
- Click in the top field of the newly opened properties window, and type StationAvgContent
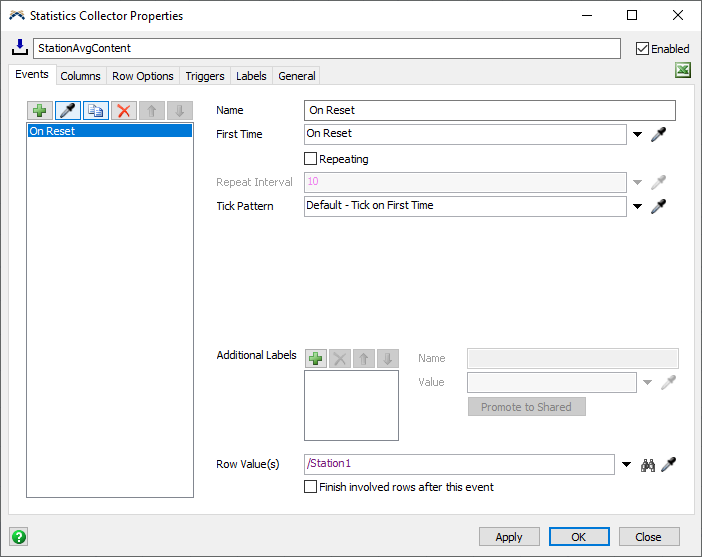
- In the open Event tab of the properties window click the
button to open the picklist option to add a new event for the statistics collector to listen to.
- Select the Create an event on reset option.
- Click the Name box, and type the name On Reset
- Click on the
 sampler tool next to the Row Value(s) box. Navigate to the 3D Model,
and with the sampler tool selected, click on Station 1, and select Station 1
option from the picklist.
sampler tool next to the Row Value(s) box. Navigate to the 3D Model,
and with the sampler tool selected, click on Station 1, and select Station 1
option from the picklist. - The Row Value(s) field should now read /Station1.
- Click on the Columns tab in the properties window.
- Click the button and choose the
Add Column option.
- Click on the name box and rename the column to be Station.
- Click on the arrow next to the Row Add Value box, point to IDs, and then choose the ID of Row Value option.
- Click the Apply button.
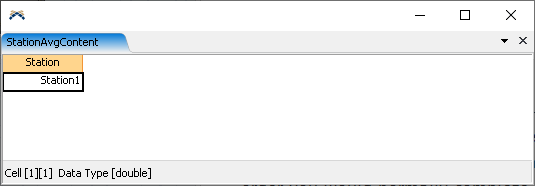
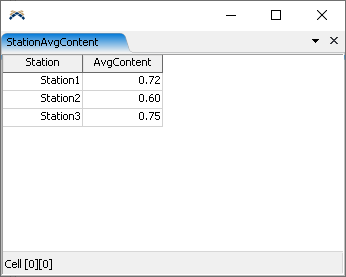
If you reset the model, you can now right click on the StationAvgContent collector under the Statistics Collectors section in your Toolbox tab, and select the View Table option. You can now see the table is populated with a column and row
Explanation
Events
All Statistics Collectors work by listening to events. This is how Statistics Collectors observe the model. When any of the events happen, the Statistics Collector will update its table somehow. In this case, you listened to the event that happens when the model is reset.
Event Row Values
When you specify which event to listen to, you must also specify a Row Value. When the event happens, it yields the specified row value. The statistics collector keeps an internal list of row values. If an event yields a row value that isn't on the list, then the statistics collector will add a new row to its table, and connect the row value to the new row. In this case, when the model is reset, the Station event yielded Station1 as a row value. Since there wasn't a row for that value, the statistics collector added a new row for that value.
Column Row Add Value
When the statistics collector adds a row, it looks at each column. If that column has a Row Add Value, then the statistics collector will record the Row Add Value in that column in the new row. In this case, the Station column record the ID of the row value. Recall that the row value is Station1, in the model.
The data Entity
When an event happens, the statistics collector creates an entity
called data. The data entity records
information about the event that you can reference when
you update column values. In this task, you used
data.rowValue, which references the Row Value
for the event that happened.
Statistics Collector IDs
If you want to display an object in a statistics collector table, the best way is to use an ID. An ID is a number that is unique to the object. You can use the Display Format to show the object's path, instead of the number. When you picked the ID of Row Value option, the Display Format was set to Object for you.
Step 3 Getting the Average Content
After following the steps below you will be able to see the table values for each of the stations average content.
To add this functionality:
- In the stats collector properties window, under the Columns tab, click the
button and choose the Add column option.
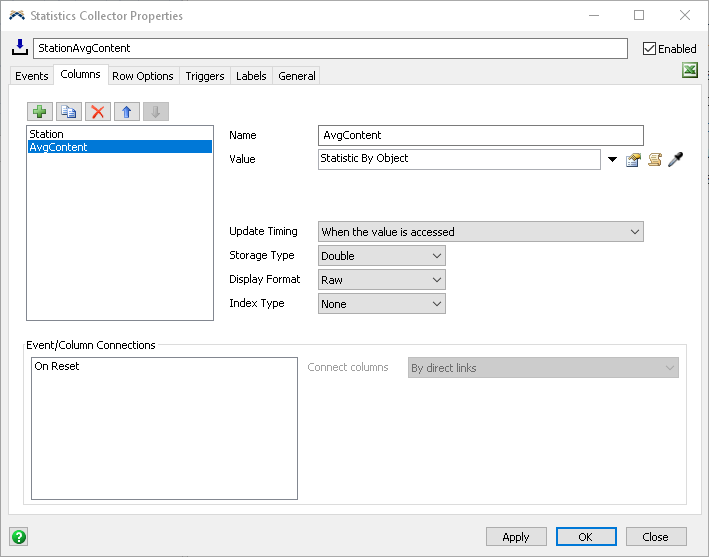
- Click on the Name box and rename the column to be AvgContent
- Click next to Update Timing and set it to When the value is acessed.
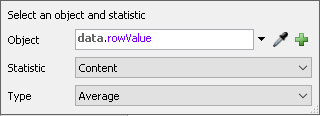
- Click on the arrow next to the Value box to bring up the picklist option, select the Object Statistics category, and the Statistics by Object option. This will bring up an options selection window.
- Click on the arrow next to the Object box, and select data.rowValue from the options. The Statistics field should be set on Content as the default, but if it isn’t select Content from the picklist.
- In the Type field, select Average from the picklist options.
- Click the Apply button.
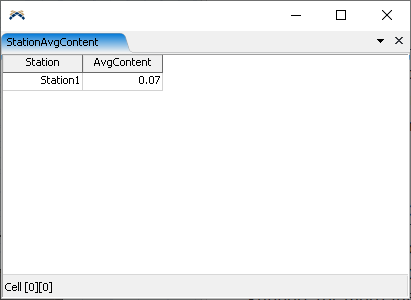
Reset and run the model. If you view the table of the statistics collector now, you should see the second column’s cell will be populated by the average content of Station 1 as the model runs.
In the model the stations have already been put together into a Group. If you look under the Toolbox tab under the Groups category, you will see a group called Stations.
To add the other stations onto the statistics collector do the following:
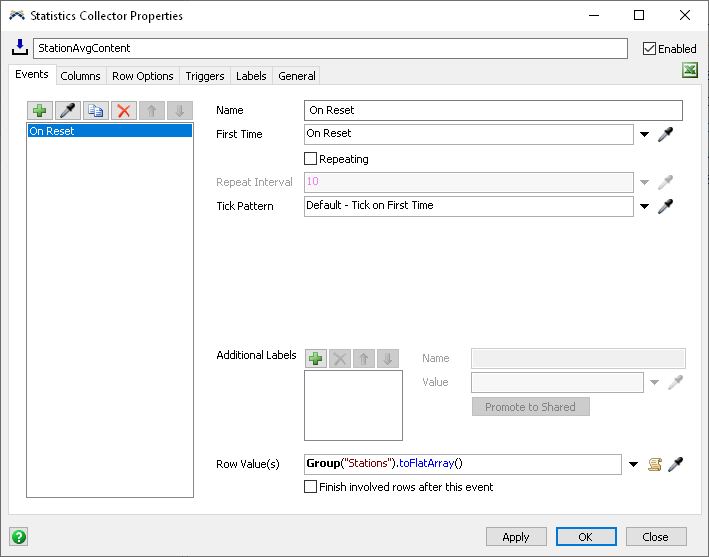
- In the statistics collector properties window, navigate to the Events tab. Be sure that the On Reset event is selected.
- Click the arrow next to the Row Value(s) to bring up the picklist option. Select the All Members of Group option, and choose the Stations group selection. It will look like this when you are finished:
Now if you reset and run the model again, you can view the table and see the other stations listed as well.
Explanation
Column Update Timing
In this step, you added a column, and set its update timing to Update when accessed. This update timing is good for values that change continuously, like the average content of an object. When you access or view a table with this kind of column in it, the statistics collector will make sure those values are up to date. The statistics collector assumes that all other columns are already up to date.
Multiple Row Values in an Event
In this step, you changed the On Reset event to yield an array of all the objects in the Stations group. When an event yields an array of values, the statistics collector will make sure there is a row for each value in the array.
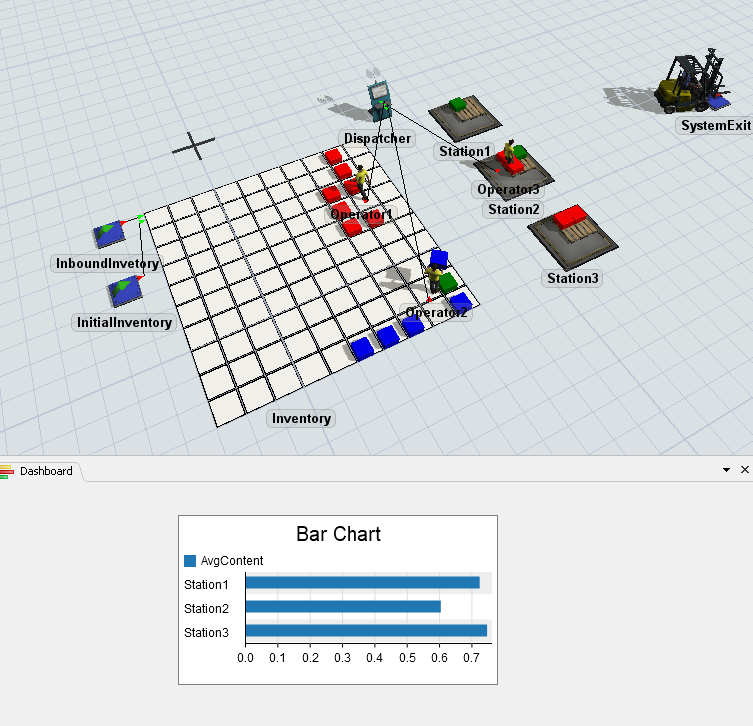
Step 4 Adding a Chart
In this final task of the task, you will connect your StationAvgContent collector to a simple bar chart in a dashboard, to display the data that it's collecting.
To do this:
- Click the Dashboards button at the top of the screen, and select the Add a Dashboard option.
- In the Properties on the right, click on the box Dashboard Name. Rename the Dashboard to be AverageStationContent.
- While the dashboard view is active, navigate to the library on the left. Find the option Bar Chart under the Base Chart Types category, and drag a bar chart into the dashboard window. This will create a new blank chart, and open its properties window
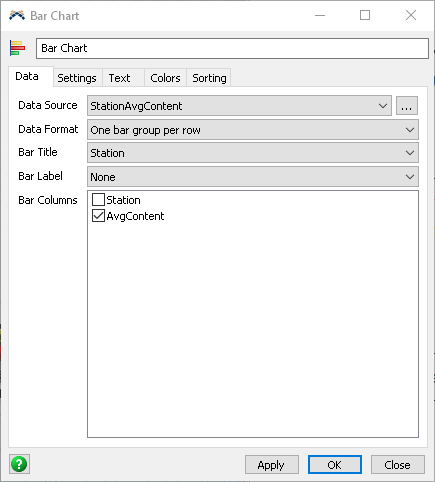
- Click on the Data Source field, and select the StationAvgContent collector from the options.
- Once selected you will now see that the Bar Title and Bar Label fields are active. Click the Bar Title field and select Station.
- Below in the Bar Columns area, make sure that the AvgContent box is checked, and that Stations is unchecked.
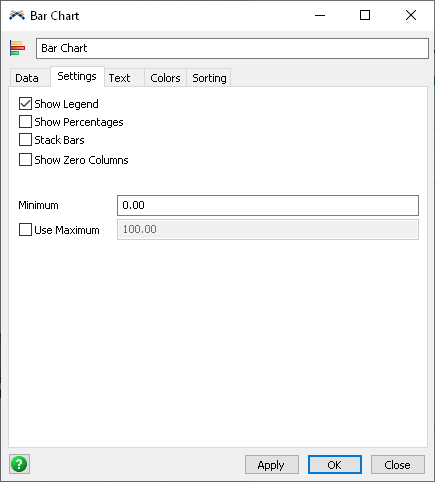
- Navigate to the Settings tab, and uncheck the Show Percentages. (We would like the chart to show the actual content value instead.)
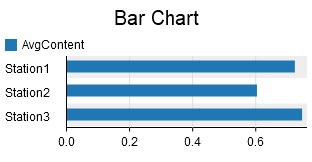
Now reset and run the model until there is content in each station. You will see that the Stations will now record the average content in the bar chart.
In the next task we will use the statistics collector to find the output of each of the stations.