Zone Partition Statistics Bar Template
Overview and Key Concepts
This template is a Zone template. It assumes that you already have a Zone in a process flow in your model, and that you want to create a chart based on partition statistics from that Zone.
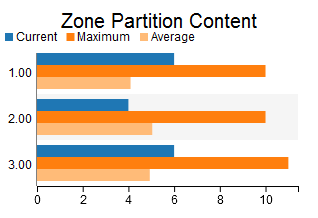
This template creates a bar chart. The bar segments show the current, minimum, maximum, and average content for each partition of the specified Zone. If you choose a local Zone from an instanced Process Flow, there will be one set of bars per partition per instance.
Properties Panels
The Zone Partition Statistics Bar template uses the following properties panels: