Zone Partition Statistics Table Template
Overview and Key Concepts
This template is a Zone template. It assumes that you already have a Zone in a process flow in your model, and that you want to create a chart based on partition statistics from that Zone.
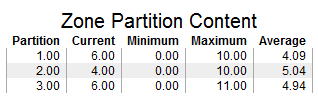
This template creates a table chart. The table shows the current, minimum, maximum, and average content for each partition of the specified Zone. If you choose a local Zone from an instanced Process Flow, there will be one row per partition per instance.
Properties Panels
The Zone Partition Statistics Table template uses the following properties panels: