Tutorial Task 2.8 - Content By Type Over Time
Task Overview
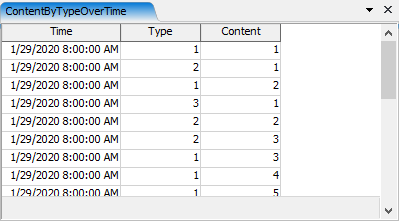
In this task, you will create a Statistics Collector that records the content in inventory by type over time:
This task is based on the same model that was used in the Task 1 of this series. For information on how to open the model, please refer to that task:
Step 1 Add Events to the Statistics Collector
In this step you will add events to the statistics collector. To do this:
- Click on the Toolbox tab on the left of the screen and click the
 button to add a new tool. Navigate to the
Statistics section and select Statistics Collector.
This will open a properties window.
button to add a new tool. Navigate to the
Statistics section and select Statistics Collector.
This will open a properties window. - Click on the field at the top and rename the statistics collector to ContentByTypeOverTime.
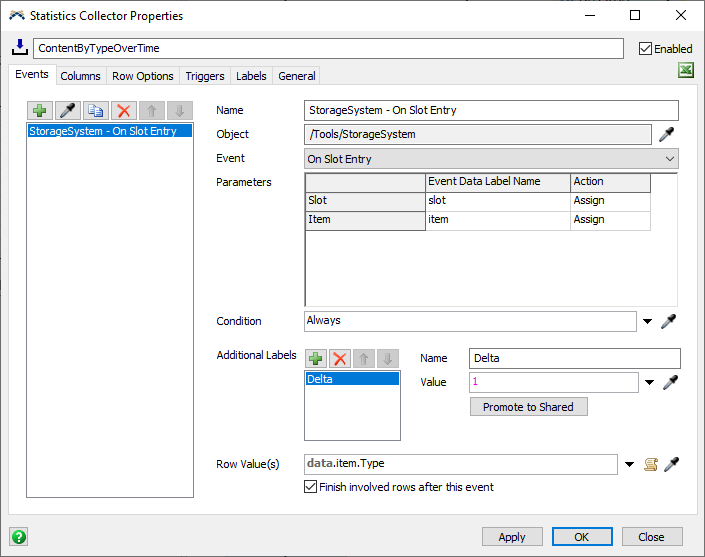
- On the Events tab, click on the sampler button
 . Then click on the Storage System
in the Toolbox. Choose the On Slot Entry option.
. Then click on the Storage System
in the Toolbox. Choose the On Slot Entry option.
- In the Additional Labels area, click the plus button
, and choose
Add label for this event....
- Set the Name of the label to Delta.
- Set the Value of the label to
1. - In the Row Value(s) field, type the following code:
data.item.Type - Check the Finish involved rows after this event box.
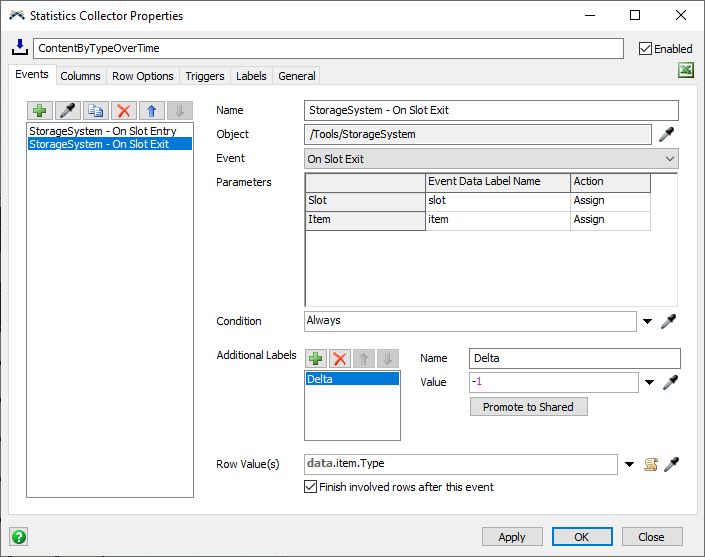
- In the top left of the Events tab,
click on the sampler button
Then click on the Storage System in the Toolbox. Choose the
On Slot Exit option.
- In the Additional Labels area, click the plus button
, and choose
Add label for this event....
- Set the Name of the label to Delta.
- Set the Value of the label to
-1. - In the Row Value(s) field, type the following code:
data.item.Type - Check the Finish involved rows after this event box.
Explanation
In this step, you listened to the On Slot Entry and On Slot Exit event. In both cases, you added a label to both events called Delta. Delta will be used later to increment or decrement the content, as items enter or exit inventory. Both events also use the item's Type label as the row value.
Step 2 Add Columns to the Statistics Collector
In this step, you will add columns to the Statistics Collector. To do this:
- Click on the Columns tab.
- Click the button
and choose Add column.
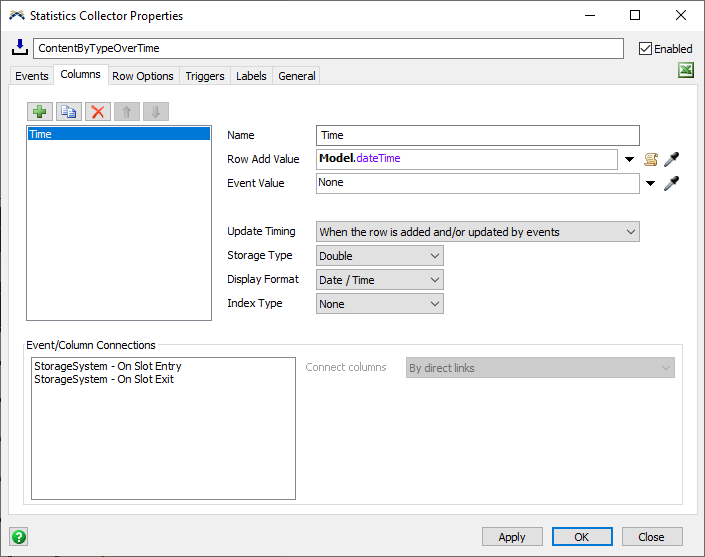
- Set the column's Name to Time.
- Click the arrow next to the Row Add Value field select Time and then select Model Date/Time.
- Click the button once again
and choose Add column.
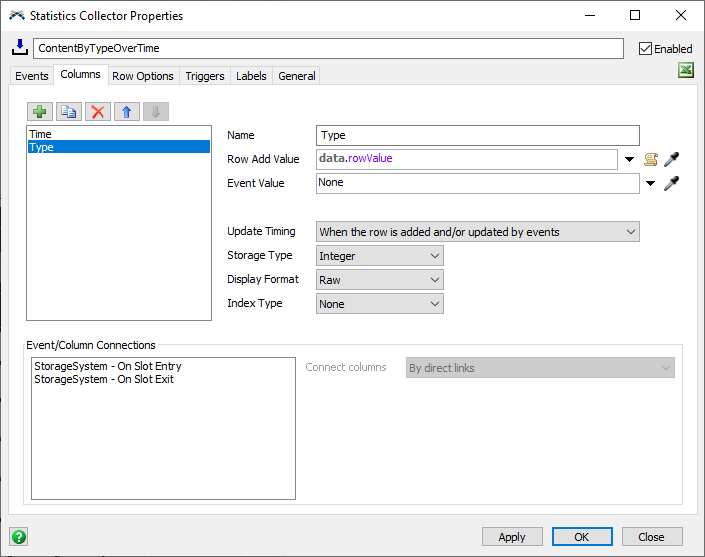
- In the Name field, rename this column to Type.
- Click the arrow next to the Row Add Value field, point to Data, and choose Row Value.
- Set the Storage Type property to Integer.
- Click the button once again
and choose Add column.
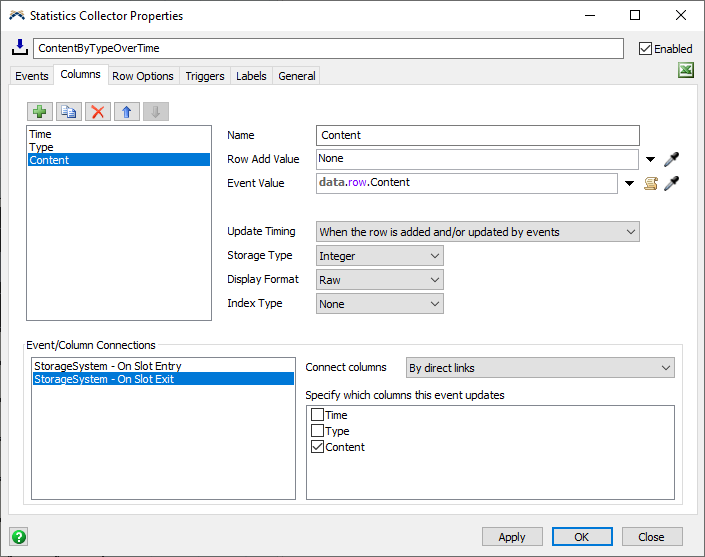
- In the Name field, rename this column to Content.
- Set the Event Value field to
data.row.Content. - Set the Storage Type property to Integer.
- In the Event/Column Connections area, select the Storage System - On Slot Entry event and check the Content box to connect this event to the Content column.
- Select the Storage System - On Slot Exit event and check the Content box to connect this event to the Content column.
Explanation
In this step, you added three columns: Time, Type, and Content. The Time
and Type columns are straightforward; whenever an item enters or exits
inventory, these
two columns will record the current time and the Type associated with each
row. The third column doesn't record a value when the row is added.
Instead, it is connected to both events. Once the row has been
added, then the statistics collector will fire its On Row Updating
trigger, and then update the connected column.
When that event happens,
the Content column will record the value of Content, a row label on the
data entity.
One remaining task is to make sure that the Content label has the correct data, which you will do later in this task.
Step 3 Set the Row Options for the Statistics Collector
This step has a single step: click on the Row Options tab, and check the Keep value and labels for finished rows box.
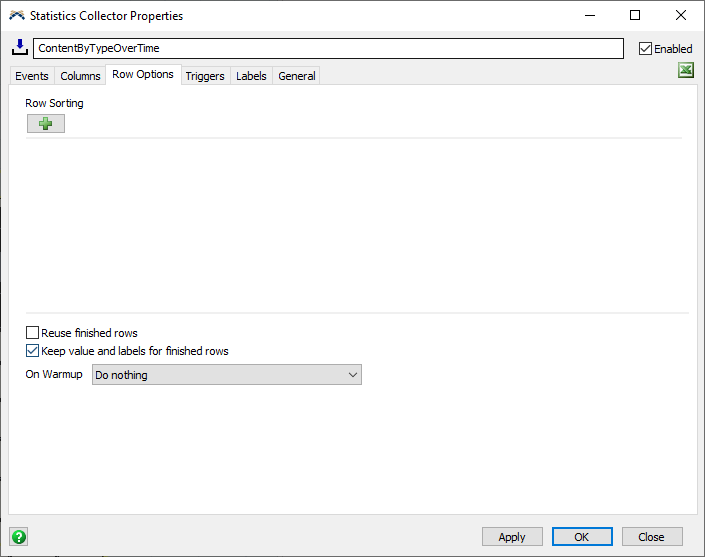
Normally, when you finish a row, the statistics collector deletes the labels connected with that row value. By checking this box, you can tell the statistics collector to keep those labels, as well as the row value. The row is still finished, however, and the row value and labels are disconnected from that row. The next time an event produces the row value, the statistics collector will add a new row, and connect the row value and the row labels to the new row.
This option allow the statistics collector to remember values between events, even though both events finish the row.
Step 4 Add Triggers to the Statistics Collector
In this step, you will add triggers to the Statistics Collector. To do this:
- Click on the Triggers tab.
- Click the plus button
and choose On Row Updating.
- Click the plus button
in the On Row Updating trigger and choose
Increment row label.
- In the popup, set the Increment
field to
"Content". - Set amount to increment by
to
data.Delta. - Click the Apply button.
You can right click on the ContentByTypeOverTime collector in the Toolbox and select the View Table option. If you reset and run the model, you will see the table record the content by type over time. You may wish to run the model as fast as possible to see the data populate.
Explanation
When an item enters the Storage System, the statistics collector
creates the data entity and adds two important labels:
- The
itemlabel (an event parameter label) records which item entered. - The
Deltalabel (an additional label) records a value of1.
This event returns the type of the item as the Row Value. Since the statistics collector always finishes its rows, it doesn't have a row for that row value. This means that it will always add a row for the value. However, because you checked the Keep value and labels for finished rows box, the Content label for that row is present, and remembers the previous value of Content for that row. Since the row value is the Type of the item, the Content label on this row matches the content for that Type.
When the row is added, the Time and Type columns are recorded. Then, the On Row Updating trigger fires, where you incremented the Content row label by Delta. In this case, Delta is 1, so the Content increases.
After the trigger fires, the statistics collector sets the Event Value of the Content column, because it is connected to the current event. In this case, the statistics collector records the value of the Content row label.
When an item exits the Storage System, the same process happens, except that the Content label is decremented, rather than incremented.
Step 5 Creating a Chart
Now you will create a chart to show the data in the statistics collector as a time plot. To do this:
- Click the Dashboards button at the top of the screen and select the Add a Dashboard option.
- While the dashboard view is active, navigate to the library on the left. Under the Base Chart Types section, find and drag a Time Plot chart onto the dashboard. This will open the new chart’s properties window.
- Click on the Data Source field and select the ContentByTypeOverTime collector from the options.
- Set the X Values property to the Time column.
- Set the Y Values property to the Content column.
- Check the Type box in the Color Split By list.
- On the Settings, change the Draw Style property to Stair Step.
- Click on the Text tab.
- Check the Custom Title box, and set the custom title to Content By Type.
- In the Show Column Headers area, check the Type box.
- Click on the Colors tab.
- Click the Edit Values button, and choose Remove all colors.
- Click the plus button
three times to add three colors.
- Click the Apply Button.
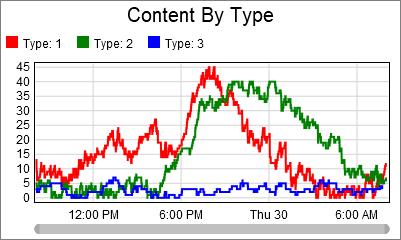
If you reset and run the model now, you will be able to see the chart show a time plot of your ContentByTypeOverTime collector. As before you may have to run the model for some time to see the results.