Task 2.1 - Build a Basic Statistics Collector
Task Overview
Statistics are the basic units of data that you'll use to get data from your model. The method you'll use to get the statistics you're interested in will depend on whether it's one of the standard statistics that are available by default in FlexSim or not. If it's not one of the standard statistics, you can create your own custom statistics using a statistics collector.
In this tutorial task, you'll get introduced to the basic features and functionality of statistics collectors. The following image provides an overview of the major phases of the process for collecting custom statistics from a model and which FlexSim tools you'll use during each phase:
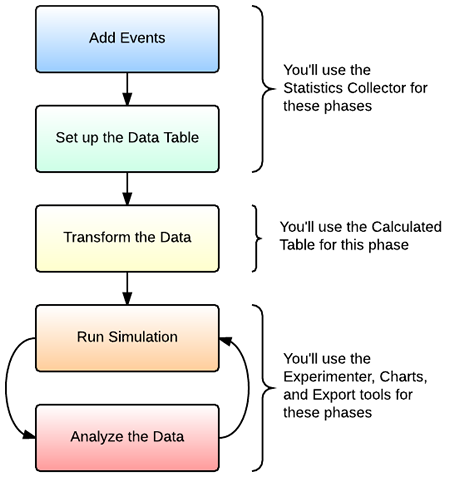
In this tutorial task, you'll focus on the first two steps in this process: adding events and setting up the data table. You'll set up a basic statistics collector that will listen to and record the amount of time it takes a processor to process flow items.
You'll also learn how to link dashboard charts to a statistics collector's data table to visualize the data.
See Key Concepts About Getting Data and Using the Statistics Collector for more detailed information about the data-gathering process.
Step 1 Build a Basic 3D Model
In this step, you'll build a basic 3D model. The 3D model itself will be fairly simple since the main focus in this tutorial will be on how to get a wide variety of data from the simulation model.
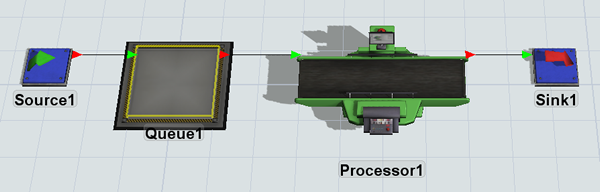
When you're finished, your 3D model should look similar to the following image:
In this tutorial task, you'll focus on collecting data about the processing times for flow items. For that reason, you'll set the processor's staytime to use a statistical distribution so that there is some randomness in the processing times. For this tutorial, you'll use the normal distribution, which is similar to a traditional bell curve.
To build this 3D model:
- Drag the following objects from the Library and place them on the plane in this
order from left to right:
- 1 Source
- 1 Queue
- 1 Processor
- 1 Sink
- Also check that all the 3D objects have a 1 after them, such as Source1, Queue1, etc. Rename them if needed.
- Create port connections (A-connects) from:
- Source1 to Queue1
- Queue1 to Processor1
- Processor1 to Sink1
- Click Processor1 to select it.
- In Quick Properties under the Processor group, click the arrow next to the Process Time box to open a menu.
- Point to Statistical Distribution, then select Normal to open the Distribution Chooser.
- You'll use the default normal distribution settings for now, which sets the mean to
10.0and the standard deviation to2.0. - Click outside this window to save the changes.
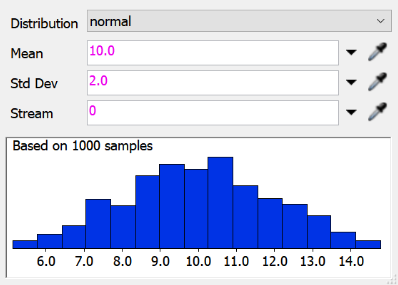
Pay particular attention to this histogram, which is a graphical representation of the normal statistical distribution. This chart displays the statistical probability of the possible processing times. Notice that most processing times will fall between 9 and 11, with the frequency of other processing times tapering off from there. When you collect data from your model about the processing times in your simulation model, the data you collect should mirror this distribution.
Step 2 Set up a Statistics Collector
In this step, you'll create a new statistics collector to gather data from your model. As was mentioned in the introduction to this tutorial task, setting up a statistics collector generally has two phases: adding events and setting up the data table.
When you add events to the statistics collector, you're basically telling it which objects and events you want to gather data from (also referred to as event listening). In this model, you'll set up the collector so that it will listen to the processor and record the how long it takes to process flow items. In FlexSim, this statistic is usually referred to as the processor's staytime. Then, you'll set up a simple data table that will display the staytime for each item that is processed by the processor.
To set up the statistics collector:
- In the Toolbox, click the Add button
 to open a menu. Point to
Statistics, then select Statistics
Collector. The properties window for the new statistics collector will open
automatically.
to open a menu. Point to
Statistics, then select Statistics
Collector. The properties window for the new statistics collector will open
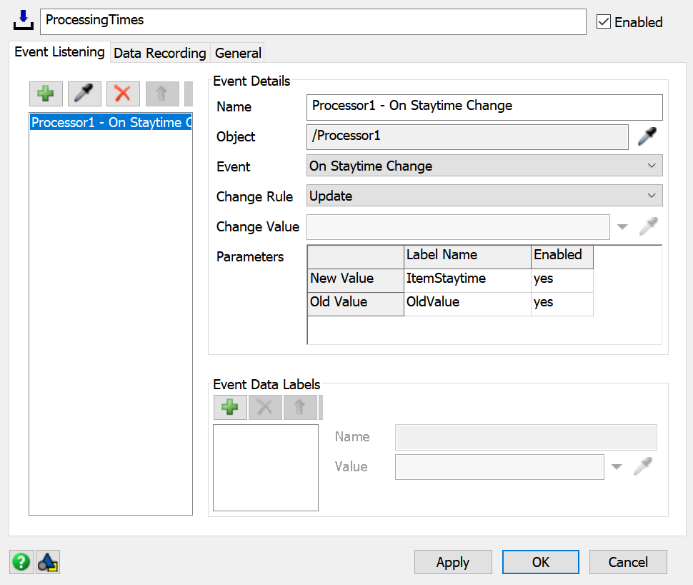
automatically. - In the name box at the top of the window, change the name of the statistics collector to ProcessingTimes.
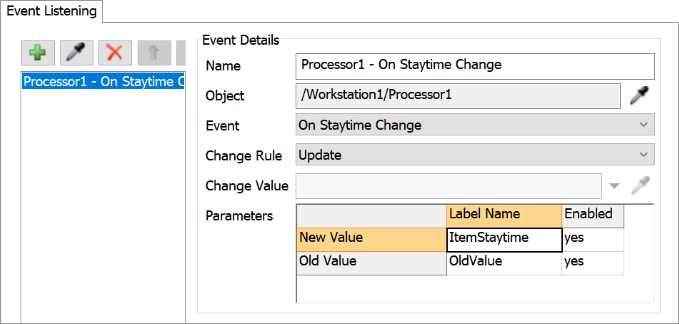
- In the Event Listening tab, click the
Sampler button
 to enter sampling mode.
 - Click Processor1 to open a menu. Select On Staytime Change to sample this event. Notice that this event now shows up in the statistic collector's event list.
- In the Event Details group, click the Change Rule menu and select Update.
- In the Parameters table, change the Label Name of the New Value parameter to ItemStaytime.
- In the Data Recording tab under the Rows group, confirm that the Row Creation Mode is set to Add Per Event.
- Under the Columns group, click the
Add button
to add a new column to the data table.
- In the Name box, change the display name of the column to Staytime.
- Click the arrow next to the Value box to open a menu. Point to Event Data and select Event Data Label Value.
- The Value box now displays
data.labelName. Delete the text after the dot to change it todata.ItemStaytime. - Press the Apply button to save the changes. Leave the statistics collector open for now.
Consider saving your simulation model at this point.
Step 3 View the Data Table
In this step, you'll open the data table to view the raw data being collected by the ProcessingTimes statistics collector you just created. You'll run a simulation model and watch the data table as it is populated in real time:
- In the Toolbox under the Statistics Collectors group, right-click the ProcessingTimes collector to open a menu. Select View Table to open the data table for this collector. For now, the table should be blank.
- Press the Reset button on the simulation control bar. Notice that the Staytime column now appears in the data table.
- Run the simulation model.
As the model runs, watch as the data table populates with staytime data after each flow item leaves the processor:
Notice also that the data table matches the rows and columns settings in the statistics collector you just created. Go ahead and close both the statistics collector and data table now.
Step 4 Create a Histogram Chart
In this step, you'll create a chart to visualize the data from the statistics collector. First, you'll choose a chart from the chart library that will graphically represent the data you're interested in. Then, you'll link this chart to the statistics collector to visualize the data that was collected in the data table.
Since the ProcessingTimes statistics collector is gathering data about the staytime of items in the processor, a histogram is a good way to represent this data. Histograms can display the trends in the frequency of processing times as a simulation model runs. In fact, you might recall that when you set up the statistical distribution for the processor in the first step of this tutorial task, the Distribution Chooser displayed a histogram for the normal distribution.
To create a histogram chart.
- Click Dashboards on the main toolbar to open a menu. Select Add a dashboard.
- In the Library under the Charts group, drag a Histogram chart into the dashboard. Its properties window will automatically open.
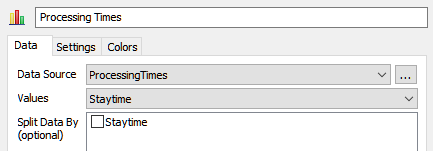
- In the name box at the top of the properties, change the chart's display name to Processing Times.
- In the Data tab, click the Data Source menu and select ProcessingTimes.
- Confirm that the Values menu lists Staytime, which is the only column from the statistics collector's data table.
- Press the OK button to save the changes and close the window.
If you haven't reset your model yet, the histogram will update to display the data collected in the ProcessingTimes data table so far.
Step 5 Run the Simulation Model
In this step, you'll run the simulation model long enough to get representative data about the processing times for the flow items.
- On the simulation control bar, click the arrow next to Run Speed to open its properties. In the Custom box, type 500 and press the Set button.
- Reset and run the model.
Watch the histogram chart as the model runs:
You'll notice that gradually the Processing Times chart will begin to look more and more like the bell curve over time. Since you were using the normal statistical distribution to randomly assign processing times, that means you've successfully gathered data about overall processing times from your simulation model.
Conclusion
Now that you've completed this tutorial task, you've hopefully gotten a good sense of some of the basics of using the Statistics Collector. In the next tutorial task, you'll learn how to use the Statistics Collector to collect and compare data from multiple objects. Continue on to Tutorial 2.2 - Get Data from Multiple Objects.