Using the Calculated Table
About the Calculated Table
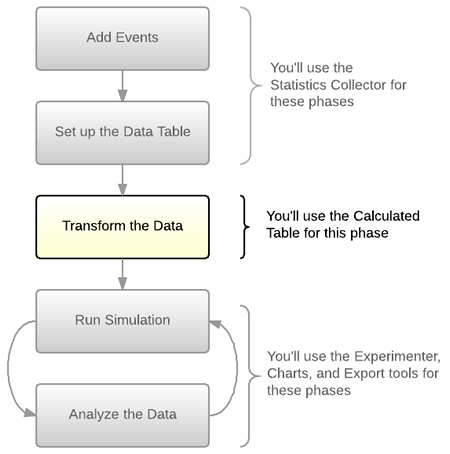
If you'll recall from reading the Overview of Advanced Data Gathering, there are five basic phases involved in getting custom statistics from a simulation model. The Calculated Table tool is involved in the third phase:
The purpose of a calculated table is to transform the raw data from the data table that was generated in a statistics collector's data table. Calculated tables can transform this data in a variety of ways, including but not limited to:
- Filtering - Calculated tables could filter raw data to only show you data that meets a specific criteria. You could filter data so that it only shows you data that falls within a specific range or above a certain threshold. You could also filter data to show you the minimum or maximum values in a range of data.
- Calculations - Calculated tables can perform mathematical calculations such as addition, subtraction, multiplication, etc. It can also give you the average for a range of data.
- Comparisons - You can use calculated tables to compare two different data sets side by side.
- Consolidation - If you are working with several different statistics collectors, you could use a calculated table to combine all the data into one table.
Creating a New Calculated Table
Calculated tables need to reference a data table in a statistics collector in order to function property. Although you could possibly set up a calculated table before setting up a statistics collector, it would be difficult to do so. See Using the Statistics Collector for more information.
One important concept to keep in mind is that each calculated table will always have its own data table associated with it. If you would like to create multiple tables, you should create a separate calculated table for each one.
You can add, manage, and delete calculated tables using the Toolbox. See Using the Toolbox for more information.
Setting the Update Frequency
When you first create a calculated table, you'll need to decide how frequently the calculated table will refresh itself and update the values in the cells during a simulation run. When deciding the update frequency, you'll need to balance the need for current data against the need not to overtax your computer's processing capability. The following image highlights the properties that are relevant to setting the update frequency:
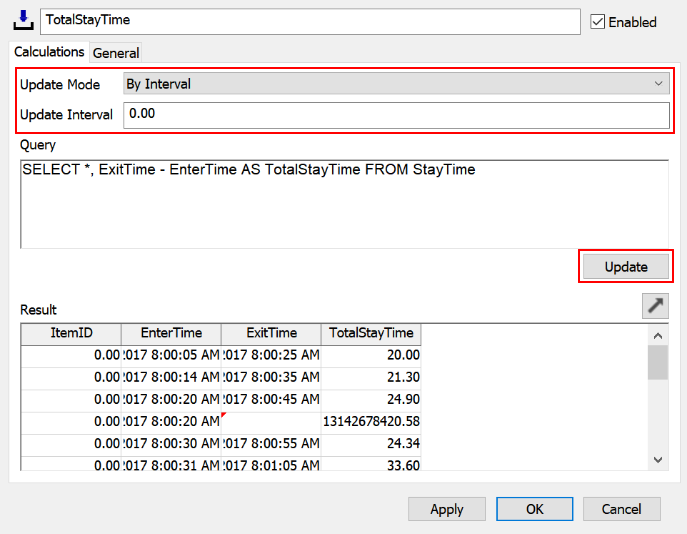
Calculated tables have three update options:
- Manual - If you choose this option, the calculated table will not update unless you update it yourself. You can update the table during a simulation run by clicking the Update button in the calculated table's properties window.
- By Interval - If you choose this option, the calculated table will update at regular intervals during a simulation run. You will need to enter the interval time (in simulation time units) in the Update Interval box.
- Always - If you choose this option and you are viewing a calculated table or chart during a simulation run, the table or chart will update every time the screen paints during a simulation run.
Writing an SQL Query
The Query box controls what is displayed and calculated in the calculated table.
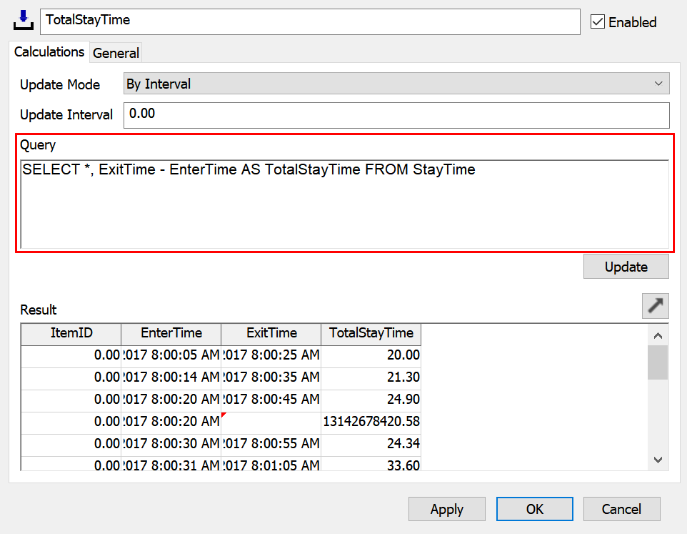
This box uses SQL to write queries. You might already be familiar with SQL since FlexSim's Global List tool frequently uses SQL expressions. Learning SQL generally doesn't take more than a few day's effort and there are many high-quality resources available at free or low cost on the Internet. One recommended resource is Code School's Try SQL course. The Level 1 course is currently free for anyone who sets up an account.
Validating a Calculated Table
You might want to test your calculated table to ensure that you have written your SQL queries correctly. The best way to test this is to view your table during or after a simulation run so that there is data available to query. After writing your query, click the Update button in the calculated table to see if you get the results you expected to get.
Viewing a Calculated Table
To view a calculated table:
- With the Toolbox open, under the Calculated Tables group, look for the specific calculated table you want to view.
- Right-click the calculated table to open a menu. Select View Table.
The data table for that calculated table will then show up as a new window in the model. If you have not yet run a simulation model, the table will be blank. You can reset and run the simulation model to watch it get populated in real time.
Exporting a Calculated Table
You can export the data collected in a calculated table in a comma-separated value file (.CSV). You can then import this file into a third-party data analysis software program such as Excel or Tableau as needed.
To export the data from a calculated table:
- Before exporting the calculated table, ensure that you've run the simulation model so that the data table has is populated with the data you want.
- With the Toolbox open, under the Calculated Tables group, look for the specific calculated table you want to export.
- Right-click the calculated table to open a menu. Select Export to CSV.
- Navigate to the computer folder in which you want to save your file. Give it an appropriate name and then save the file.
The file should now be saved on your computer. Double-check that your file now shows up in the appropriate folder.