Throughput per Hour Table Template
Overview and Key Concepts
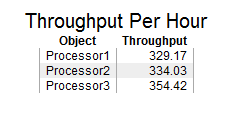
This template creates a table chart with two columns. The first column displays the path to the included objects, and the second displays the throughput (usually output) of that object, divided by the total number of hours the model has run so far.
For more information about Throughput templates, see Throughput Templates.
The Options Tab
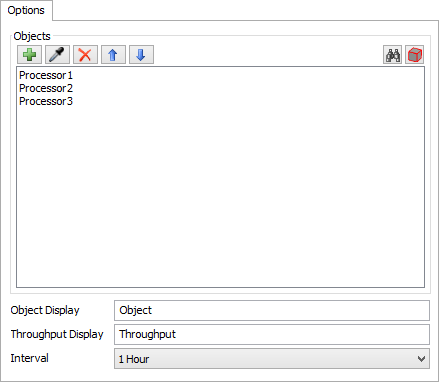
The Options tab has the following properties:
- Objects - Specifies the objects to include on the chart. See Adding Objects for more information.
- Object Display - Specifies the name of the Object column.
- Throughput Display - Specifies the name of the Throughput column.
- Interval - Specifies the desired interval of time. The value displayed in the chart is Throughput divided by n, where n is the number of Intervals that have elapsed.
The Settings Tab
The Settings tab is identical to the Table Settings tab. For more information, see Table Settings.
The Advanced Tab
This template, like all templates, uses the Advanced Tab. For more information, see Advanced Tab.