Zone Statistics Bar Template
Overview and Key Concepts
This template is a Zone template. It assumes that you already have a Zone in a process flow in your model, and that you want to create a chart based on statistics from that Zone, not including partition statistics.
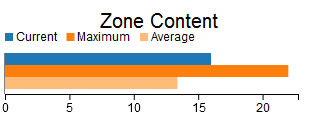
This template creates a bar chart. Each bar color shows the current, minimum, maximum, and average content for the specified Zone. If you choose a local Zone from an instanced Process Flow, there will be one set of bars per instance.
The Options Tab
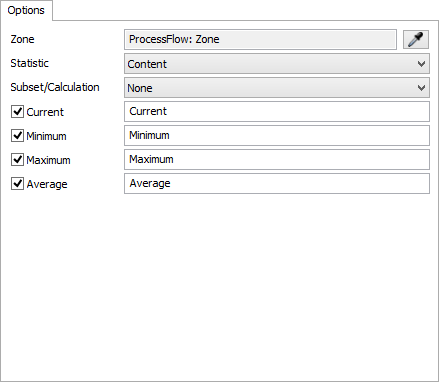
The Options tab has the following properties:
- Zone - Specifies the Zone to use as a data source.
- Statistic - Specifies which statistic to collect from the Zone. If you want to gather a Partition statistic, use the Zone Partition Statistics Bar template, instead of this template.
- Subset/Calculation - Specifies the Subset or Subset Calculation, if required. For more information, see Zone Statistics Table.
- Current - Specifies whether the Current column is present. If checked, you can edit the name of this column in the associated edit field.
- Minimum - Specifies whether the Minimum column is present. If checked, you can edit the name of this column in the associated edit field.
- Maximum - Specifies whether the Maximum column is present. If checked, you can edit the name of this column in the associated edit field.
- Average - Specifies whether the Average column is present. If checked, you can edit the name of this column in the associated edit field.
The Settings Tab
The Settings tab is identical to the Bar Settings tab. For more information, see Bar Settings.
The Colors Tab
The Colors tab is identical to the Bar Colors tab. For more information, see Bar Colors.
The Advanced Tab
This template, like all templates, uses the Advanced Tab. For more information, see Advanced Tab.