Table Chart
Overview and Key Concepts
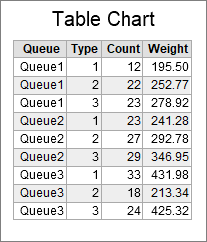
The table chart can be used to display the data in a Statistics Collector table or Calculated Table as a chart.
The Data Tab
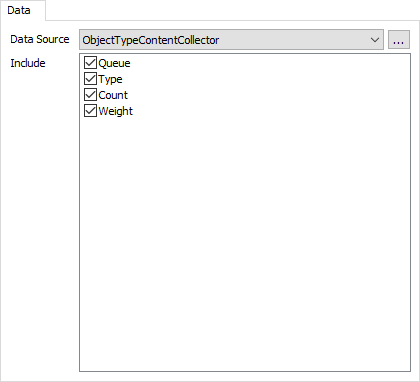
The data tab has the following properties:
- Data Source - Choose a valid data source from the drop down list. All Statistics Collectors and Calculated Tables are shown. You can also choose the last option to create a new Statistics Collector. You can click the accompanying button to open the properties window for the selected data source.
- Include - Choose which columns will be included in the table.
The Text Tab
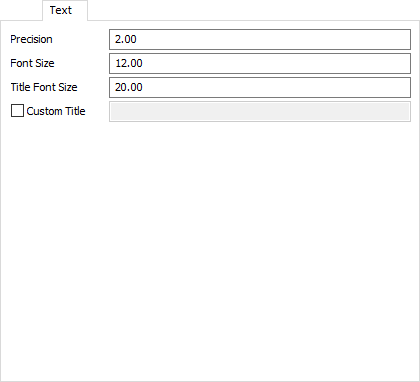
The settings tab has the following properties:
- Precision - Specify the number of decimals to use on the chart.
- Font Size - Set the font size for general text on this chart in pixels.
- Title Font Size - Set the font size for the chart title.
- Custom Title - If checked, you can specify a custom title for the chart. The custom title can have special characters, and can be blank if desired.
Performance Measures
The Table chart provides aggregates of each included numeric column as performance measures. For each column, the chart provides the Average, Sum, Minimum, and Maximum as a possible performance measure.