RailWorks Dashboards
RailWorks Dashboards
RailWorks comes with seven custom Dashboards to get data from the model and display it in a more easily visual way. The current Dashboards that are in the module are:
- AVG Station Content Staytime
- AVG Train Staytime On Station
- Rail Distance VS Time
- Railway Staytime
- Station Content
- Train Ocupation On Station
- Train Speed VS Time
Custom Dashboards
This section shows all the Dashboards that RailWorks come with, populated with data to help visualize the purpose with which one.
AVG Station Content Staytime
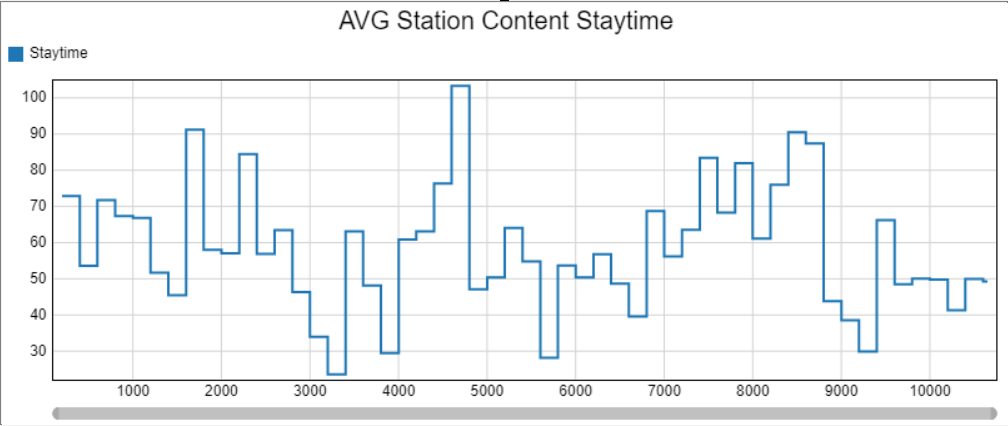 Target Object: Station
This dashboard shows the avarage time that the flowitens stay inside the Station object as content.
AVG Train Staytime On Station
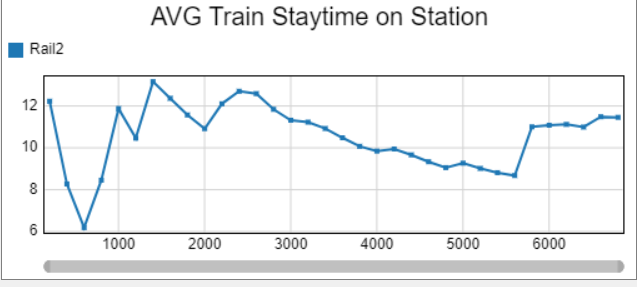 Target Object: Station
This dashboard shows the avarage time spent by locomotives inside rails connected to the Station.
Rail Distance VS Time
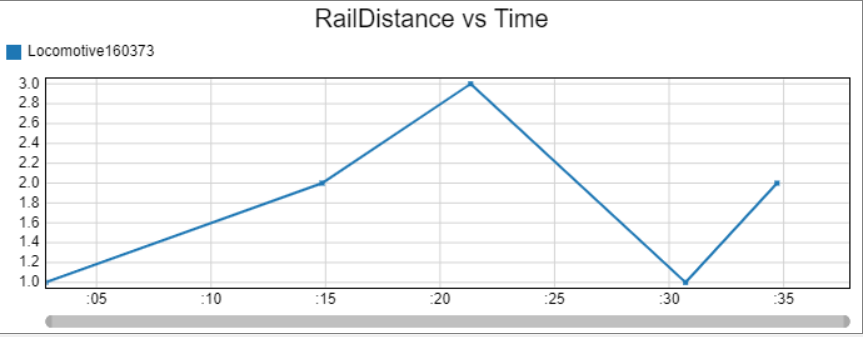 Target Object: Stations
This dashboard shows the time which each Locomotive has arrived at the group of selected Stations.
Railway Staytime
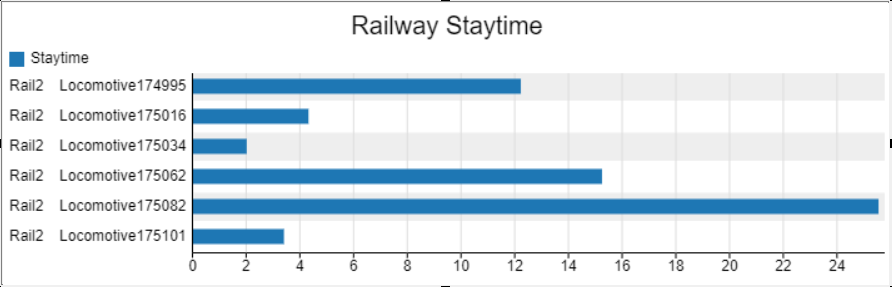 Target Object: Rail
This dashboard shows the time spent by each Locomotive on the selected Rail.
Station Content
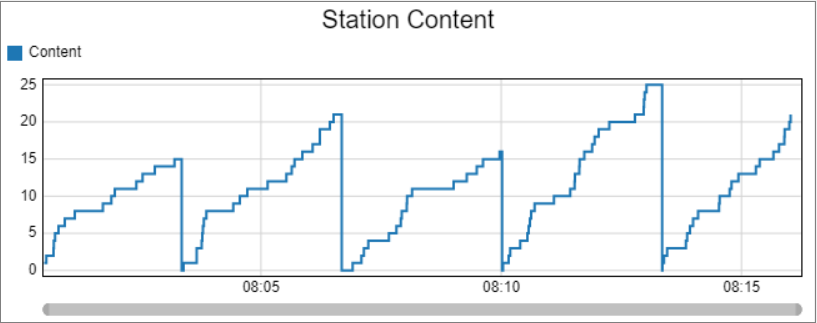 Target Object: Station
This dashboard shows the current content value of the Station by the model runtime.
Train Ocupation On Station
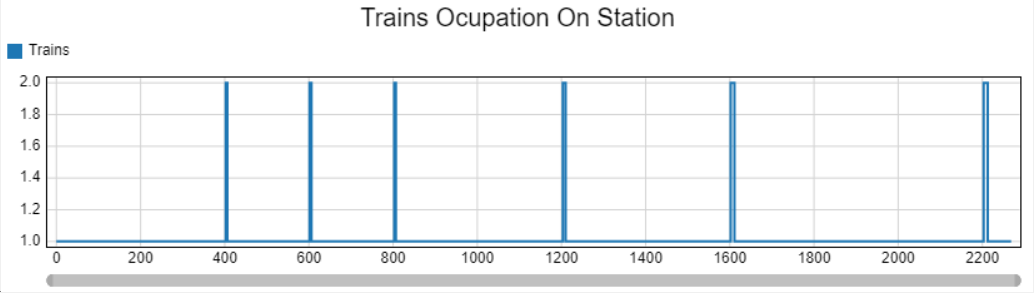 Target Object: Station
This dashboard shows the amount of Locomotives parked at the selected Station by the model runtime.
Train Speed VS Time
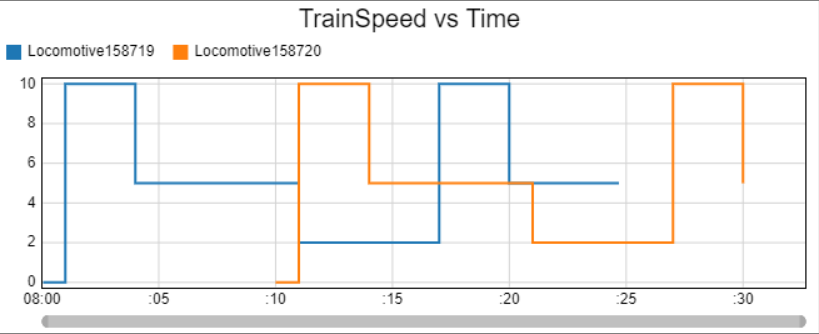 Target Object: Rails
This dashboard shows each locomotive's speed by the time that they pass through each selected Rail object.