Chart Templates
Overview and Key Concepts
A Chart Template provides a quick and easy way to make a Dashboard chart. You can use a Chart Template to display your model's statistics in an intuitive way. The following charts are just a few of the available templates.

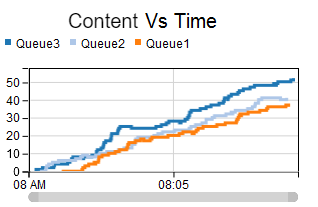
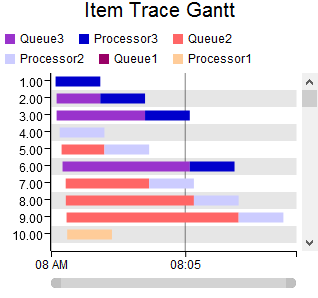
Chart Templates use other FlexSim tools internally to display data on a chart. Each one uses a Statistics Collector to gather data. Depending on what data is being displayed, a template may also use two Groups, a General Process Flow, and a Calculated Table. The Chart Template is basically a shortcut for creating and configuring all of these tools together to create a chart. The Properties window for each template allows you to configure the chart name, the template options, and other visualization options.
Installing a Chart Template
Chart Templates can be installed. This means that the internal tools used by the template will be transferred to the toolbox. You can then modify any of those components freely. However, the simple interface for modifying the template will no longer be available.
Composite Templates
Many of the Chart Templates are composite templates. These templates allow you to define a set of objects and treat them as a single object for statistical purposes. For example, let's look at this simple model:
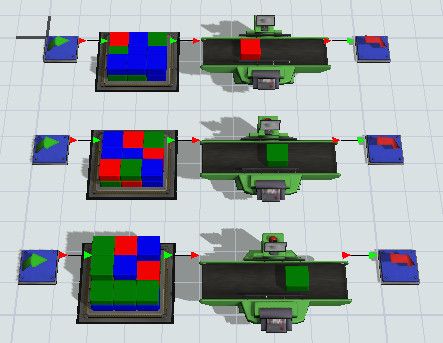
Each of the objects is keeping statistics for itself. However, many key performance indicators (KPIs) deal with higher-level statistics. For example, a common KPI is the average time in system. We can get this statistic using the Composite Staytime template:
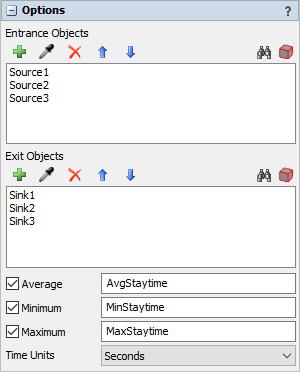
This template needs a list of entrance and exit objects. It then measures the time items take to get from any entrance object to any exit object. In this case, we will measure how long it takes to get from any source to any sink, and report the resulting average, minimum, and maximum. The resulting chart looks like this:

Composite templates can also be used to gather data about smaller systems within the model. For example, we could use the Composite WIP template to get the number of items in just the queues:
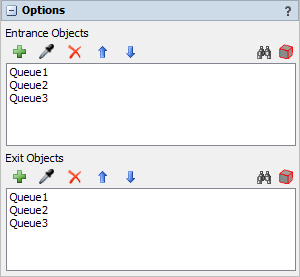
The template then measures and displays how many objects are between the entrance and exit objects. Any time an object enters any entrance object, the WIP will increase. Any time an object exits any exit object, the WIP will decrease. Since the queues are both entry and exit objects, we are measuring the total WIP in all queues:

You can create composite templates for WIP, Staytime, Throughput, and State statistics. Composite WIP and Staytime templates require you to specify Entrance and Exit objects. WIP templates count items between the Entrance and Exit objects, while Staytime templates measure the elapsed time between the Entrance and Exit objects. Throughput templates allow you to specify a set of objects, and then calculate the throughput of all those objects, as if they were a single object. State templates calculate the average time in each state for all of the objects specified.
By Type Templates
Many templates allow you to categorize items or tokens based on a label value, and then chart statistics from those categories. For example, if each flowitem has a Type label, you might want to know the time in system per Type. You can get this data using the Staytime By Type template:
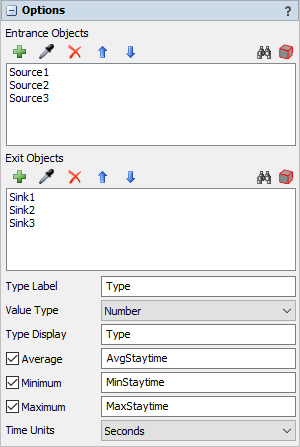
This template produces the following chart:
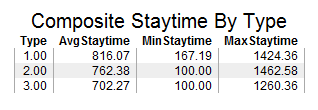
Each By Type chart will visually speparate each category's data, as follows:
- Table and Bar charts make one row per category
- Time Plot and Histogram charts use one color per category
On each By Type template, you will need to specify the following properties:

- Type Label - Specifies the name of the label used to categorize items. For WIP and Staytime templates, all items are assumed to have this label at all Entrance and Exit objects. For Throughput By Type templates, all items counted for throughput are assumed to have this label.
- Value Type - Specifies the data type of the categorization label. For numeric types (part types, sizes, etc.), choose Number. For text based values (most SKUs), choose Text. By Type charts can only categorize on Text or Number data. If the category label might be text, or might be number, then choose Text; numbers will be converted to text automatically.
Content Templates
Content Templates can be used to graph the content or WIP (work-in-progress) of many individual objects, or a composite object. To calculate WIP, these templates simply use the Content statistic of the involved objects. Content templates are designed to work with 3D objects or with process flow activities. However, if the activities belong to an instanced (Fixed Resource/Task Executor) flow, tokens from all instances will contribute to the WIP statistic.
Composite WIP templates listen to Entrance and Exit object events, and use those events to calculate the WIP between those objects. It is assumed that any item or token that flows through an Entrance object will later flow through an Exit object. The template will listen to OnEntry of the Entrance objects, and OnExit of the Exit objects. However, if a Source is specified as an Entrance object, then the template will listen to OnExit. Similarly, if a Sink is specified as an Exit object, then the template will listen to OnEntry. When an Entrance object event fires, WIP is incremented by one. When an Exit object event fires, and the item or token is matched to one that passed through before, the WIP is decremented. If the item or token is not matched, no change will occur.
Output Templates
Output Templates can be used to graph the Output of many individual objects, or a composite object. To calculate Output, these templates usually use the Output statistic of the involved objects. However, if an object is a Sink, then this template will use the Input statistic as Throughput for that object. Output Templates are designed to work with 3D objects or with process flow activites. However, if the activities belong to an instanced (Fixed Resource/Task Executor) flow, tokens from all instances will contribute to the Output statistic.
Composite Output Templates listen to the OnExit of the specified objects (unless that object is a Sink, in which case it will listen to the OnEntry of that object). Each time one of those events fire, the template will increment the throughput.
Staytime Templates
Staytime Templates can be used to graph the Staytime values of many individual objects, or a composite object. To calculate Staytime, these templates use the Staytime statistic of the involved objects. Staytime templates are designed to work with 3D objects or with process flow activites. However, if the activities belong to an instanced (Fixed Resource/Task Executor) flow, tokens from all instances will contribute to the Staytime statistic.
Composite Staytime Templates listen to the OnEntry of Entrance objects and the OnExit of Exit objects. As with Composite WIP templates, those events can be adjusted to correctly handle Source and Sink-like objects. When an Entry event fires, the template will cache of the item or token, along with the current time. When that item or token leaves (firing an Exit event), the template will record the duration between Entry and Exit for that item.
The State Templates also include an Item Trace Gantt chart. For more information, see Item Trace Gantt.
State Templates
State Templates allow you to make charts that display state information for a set of objects. To calculate the values for State, these templates use the State information stored by each object. These templates were designed to work only with Fixed Resources and Task Executors.
Composite State Templates simply average the state data collected from the specified objects.
The State Templates also include a State Gantt chart. For more information, see State Gantt.
Zone Templates
Zone Templates allow you to chart statistics from a specific Process Flow Zone in your model. When you use a Zone Template, you simply specify a Zone, and also a statistic from that Zone to chart.
All Zone statistics can be charted using one of the Zone Templates. This includes
- Subset statistics
- Subset Calculation statistics
- Unmatched (not in any subset) statistics
- Partition statistics
- Partition calculation statistics
Zone Templates are designed to work with General flows, as well as Fixed Resource and Task Executor flows. If you use a Zone Template to chart an FR or TE flow, the chart will include data from all instances.
Milestone Templates
Milestone Templates allow you to chart statistics gathered by a Milestone Collector. When you use a Milestone Template, you will need to specify which Milestone Collector the chart should use. For more information about Milestone Collectors, see the Milestone Collector reference topic.
Intervals
Most Milestone Templates require you to specify which Intervals to record. Intervals have three components:
- a name
- a start Milestone
- an end Milestone
The following image shows the interface for specifying intervals:
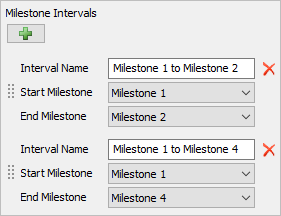
This interface as the following properties:
- Add Interval - Adds an Interval to the list.
- Interval Name - Specifies the name of the interval.
- Start Milestone - Specifies the Start Milestone.
- End Milestone - Specifies the End Milestone.
The Milestone Sankey template does not require you to specify intervals. It will automaically include all intervals that occur during the model run.
Travel Templates
Travel Templates allow you to make charts that display travel distance information for a set of objects. These templates were designed to work only with Task Executors.
Label Templates
Label Templates allow you to make charts that display the value of specified object labels.
Tracked Variable Templates
Tracked Variable Templates allow you to make charts that display the values of specified Tracked Variable objects.
Process Flow Activity Statistics Templates
Process Flow Activity Statistics Templates allow you to make charts that display statistics of specified process flow activities.
Adding Objects to Templates
Most templates allow you to specify a list of objects. The interface for specifying the list is uniform across all templates:
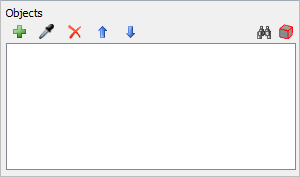
The following table explains the buttons on this tool:
| Button | Explanation |
|---|---|
 |
Opens a menu allowing you to select 3D objects, add the selected objects to the list, or set the list to the model's selected objects. |
 |
Click to enter "Sample" mode then select an object, activity, or a group to add it to the list. |
 |
Removes the selected(s) object from the list. |
 
|
Reorder members of the list. |
 |
Centers the 3D view on the selected object. |
 |
Selects (red box) the selected object. |