The Calculated Table
Overview and Key Concepts
The Calculated Table is used to analyze data found in other tables. Its primary component is a SQL query, which can be used to filter, sort, aggregate, or generate additional data. The result of that query is dumped to a bundle, called the result table. From there, the data can be exported or charted. The other options in the Calculated Table deal with how often to run the query and how to format the results for display purposes.
By default, the Calculated Table interface is meant to help you build a SQL query. This interface is called the Query Builder. The Query Builder allows you to think about the query you want from a conceptual standpoint, without worrying about exact SQL syntax.
The Calculated Table can also be used without the query builder, where you can write a custom query. For more information on writing SQL queries, see the SQL Queries page.
The Calculated Table can be accessed from the Toolbox.
The Query Builder Interface
The Query Builder Interface builds queries by considering five inputs:
- Tables
- Metrics
- Subsets
- Partitions
- Sorting
The following sections describe the concepts represented by each kind of input.
Tables
A SQL query operates on one or more input tables. The Query Builder allows you to specify which table (or tables) you want to use as input. You must specify at least one input table, or the Query Builder won't try to build a query. If you specify more than one table, then you will need to also specify how to join the extra tables.
The Query Builder will allow you to build queries involving the following kinds of tables:
- Global Tables
- Statistics Collectors
- Calculated Tables
- Chart Templates
- Experiment Result Tables
The Query Builder will use the input tables you specify to build the FROM statement in the final query.
Metrics
A metric specifies the data you want to retrieve from one of the input tables. Metrics look at data in a column. For example, you could use a metric to get the average of the values in a particular column. You could also use a metric to retrieve all the values from a particular column. You must specify at least one metric; otherwise, the Query Builder won't try to build a query.
The Query Builder will use the metrics you specify to build the SELECT statement. If the Metric Layout is set to add a new column for this metric, then the Query Builder adds a single expression for this query. If the layout is set to use shared name/value columns, then the Query Builder will create a query that runs one per metric with this layout. The Metric Name will be put in a column called Metric Name, and the value will be put in a column called Metric Value. When all the sub-queries are concatenated, the name and value columns will be shared across all sub-queries.
Subsets
Subsets allow you to specify filters for your data. A filter is a test for whether or not to include a table row in the final result. You can have mutliple filters as part of a subset. Only rows that pass all the filters will be included in the result table.
The Query Builder uses each subset to build a WHERE statement. If you have more than one subset, then the query will be written once for each subset (the same query, but with different WHERE statements), and the resulting queries will be concatenated with UNION ALL. If you have any subsets, the QueryBuilder will add a column called Subset to the result table, with the name of the subset as a value.
Partitions
A partition categorizes each data point. The result table will then show the category of each result row. If you have aggregation (or window function) metrics, then the aggregation will be performed for each value in the partition.
The Query Builder uses partitions to build a GROUP BY statement. If a metric is a window function, then partitions are used in the PARTITION BY statement of the metric's SELECT expression. The Query Builder also adds a column for each partition to the SELECT statement.
Sorting
Sorting applies only to the result table. If you choose to sort, then the resulting query will be sorted by subset (if any), and then by each partition (if any). If there are no partitions, the final query will not be sorted.
The Query Builder will build an ORDER BY statement, if sorting will occur. If there are subsets and partitions, then the query builder will form a nested query.
Example 1 - Averaging Data with a Metric
This example will cover how to use the Query Builder interface to build a query that averages data in a column in a Global Table. You will need to re-create the Global Table and create a new Calculated Table to complete this example. For more information on Global Tables, see the Global Tables topic.
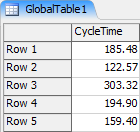
Global Table
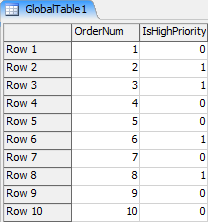
This example assumes that the following Global Table exists in the model:
Configuring the Tables
In the Tables group box, lick the
 button, choose Global Tables, then choose GlobalTable1.
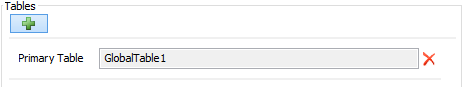
Doing this tells the Query Builder that you want to get data from GlobalTable1.
Configuring the Metrics
- In the Metrics group box, click the
button, and choose Aggregation of column
- Set the Metric Name to AvgCycleTime
- Set the Aggregation to Average
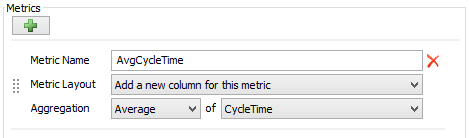
Doing this tells the Query Builder that you want to get the average of the CycleTime column as a metric.
Build and Run the Query
Go to the Calculations tab, and click the Update button:
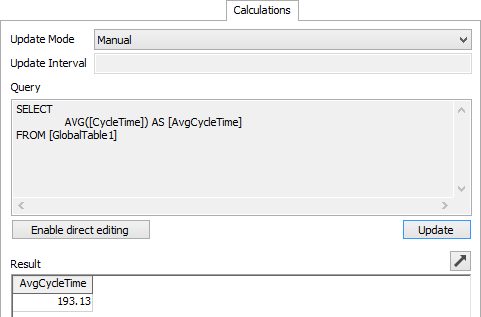
On this tab, you can view the query made by the Query Builder, as well as the result of that query. In this case, the result table has a single row and column, showing the average of the CycleTime column.
Example 2 - Filtering and Comparing Data with Subsets
This example will cover how to use the Query Builder interface to build a query that averages data in a column in a Global Table. You will need to re-create the Global Table and create a new Calculated Table to complete this example. For more information on Global Tables, see the Global Tables topic.
Global Table
This example assumes that the following Global Table exists in the model:
Configuring the Tables
In the Tables group box, click the
button, choose Global Tables, then choose GlobalTable1.
Configuring the Metrics
- In the Metrics group box, click the
button, and choose Aggregation of column
- Set the Metric Name to Orders
- Set the Aggregation to Count
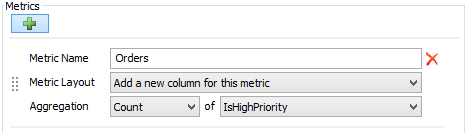
Doing this tells the Query Builder that you want to count the number of rows where the OrderNum is not null.
Configuring the Subsets
- At the top of the Subsets tab, click the
button to add a new Subset.
- Set the Subset Name to Total
- Use the same
button to add another new Subset.
- Set the Subset Name to High Priority
- In the Subset Filters group box,
click the
button to add a filter to the current subset. Choose
"Compare column and value"
- Set first dropdown to "IsHighPriority"
- Set the second dropdown to "="
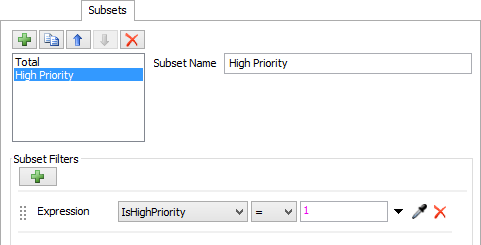
Adding two subsets tells the query that you want to run the query twice, once with all the rows from the global table, and once only with rows that have a 1 in the IsHighPriority column, and that you would like both queries to be shown in the same table.
Build and Run the Query
Go to the Calculations tab, and click the Update button:
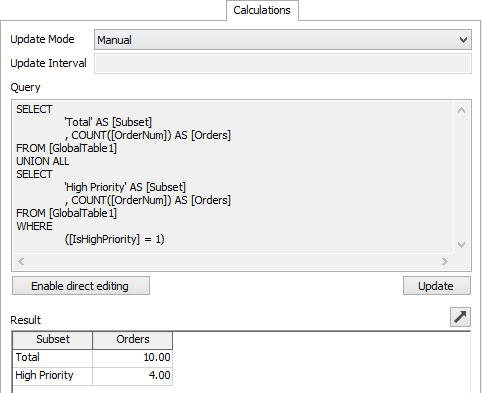
On this tab, you can view the query made by the Query Builder, as well as the result of that query. In this case, the result table has two rows and two columns. The first row comes from the first subset, so it shows that the total number of orders is 10. The second row comes from the second subset, which only considers high priority orders. The count of those orders is only 4.
Properties
The Calculated Table has five tabs with various properties. These properties will be explained in more detail in next five sections.
The Tables/Metrics Tab
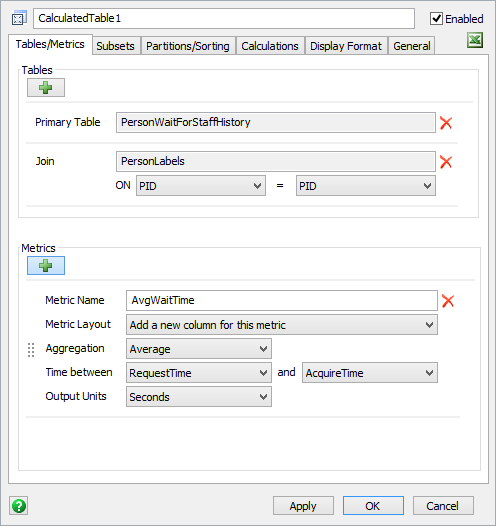
The Tables/Metrics tab provides an interface that allows you to specify the tables and metrics used by the Query Builder.
The Tables/Metrics tab has the following properties:
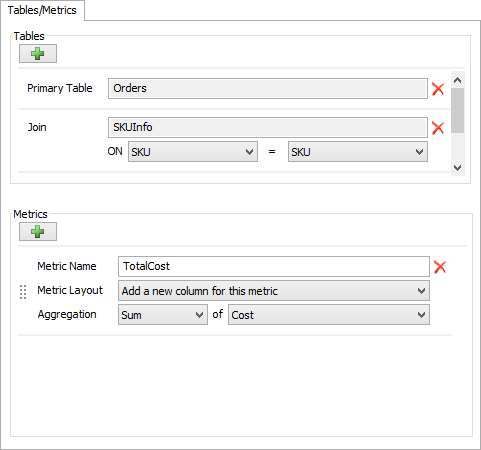
Tables
The Tables area allows you to specify the list of tables to use in the Query Builder. If more than one table is specified, the interface will provide dropdowns that enable you to specify which columns to use in the join statement. If the table is accessible only by name (such as the Experiment result tables), then first field in the table's panel will allow you to edit the name.
Metrics
The Metrics area allows you to specify the list of metrics to use in the Query Builder. Each metric will allow you to edit the Metric Name property, as well as the Metric Layout property. Additional options will vary, depending on what kind of metric is chosen. Most will involve picking at least one column from a dropdown list.
The Subsets Tab
The Subsets tab provides an interface that allows you to specify the subsets used by the Query Builder.
The Subsets tab has the following properties:
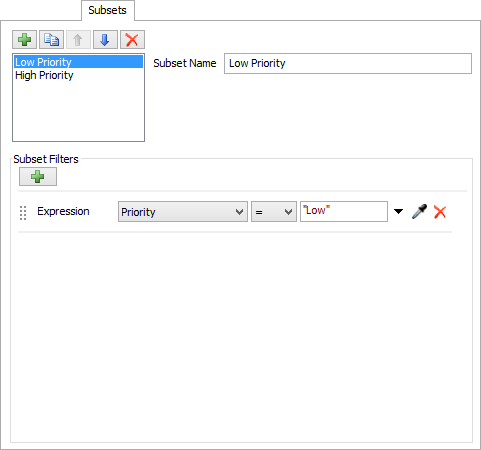
Subset List
The Subset List area is the area above the Subset Filters group box. This area allows you to specify each of the Subsets you would like to create. The following list explains each of the properties in this area:
-
- Adds a new subset. There are two possible options:
- Add subsets for People Groups or Objects - Adds a special kind of subset that makes it easy to compare group and individual statistics for People/HC groups and objects.
- Add basic subset - Adds a general use subset.
 - Duplicates the selected subset
 - Moves the selected subset up in the list
 - Moves the selected subset down in the list
 - Deletes the selected subset
- Subset Name - Displays and allows you to edit the name of the selected subset
Subset Filters
The Subset Filters area shows the list
of filters for the selected subset, if it is a basic subset. You can add a new filter with the
button.
Depending on which kind of filter you add, the panel for that filter
will have properties for configuring that filter.
Options and Addtional Filters
If the selected Subset is a People/HC Group subset, the following interface will appear:
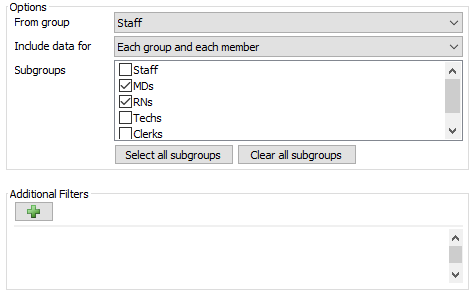
This interface allows you to choose which groups you would like to compare in a table. If this Query Builder is part of a Chart Template, then those groups will appear on the chart associated with the template. It has the following properties:
- From Group - Allows you to specify which People/HC resource group to use. This field will be set to the correct value if the list of tables includes one of the resource group tables - StaffGroups, LocationGroups, TransportGroups, or EquipmentGroups.
- Include data for - Select what kind of data for
each selected group should be included. There are three possible options:
- Each group as a whole - creates one subset per selected group that only include rows that deal with objects from the whole group.
- Each member of each group - creates one subset per member of each selected group. Each created subset only includes rows that deal with the specific member.
- Each group and each member - creates one subset per group as well as one subset per member of the group.
- Subgroups - Use the checkboxes to choose which groups to include in the final table.
- Select all subgroups - Press this button to select all subgroups shown in the list except the overall group.
- Clear all subgroups - Press this button to clear all subgroups shown in the list except the overall group.
- Additional Filters - If you require filters in addition to showing only group or individual rows, you can use this section to add them. They will be combined with the group or individual filters using an AND statement.
The Partitions/Sorting Tab
The Partitions/Sorting tab provides an interface that allows you to specify the partitions used by the Query Builder, and whether or not the results should be sorted.
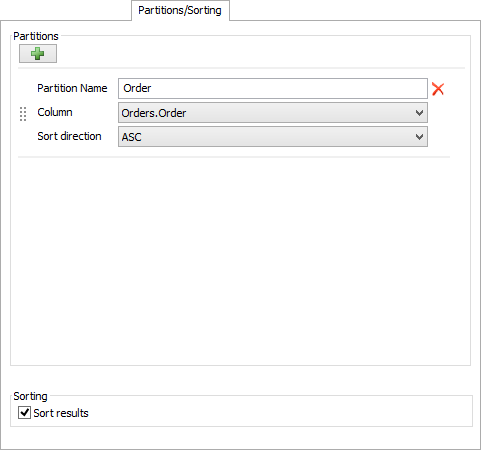
The Partitions/Sorting tab has the following properties:
Partitions
The Partitions area allows you to specify the way the result table should be partitioned, if at all. Each partition allows you to specify the Partition Name and the Sort Direction. Other properties depend on the kind of partition you have added.
Sort Results
Check this box to indicate that the result table should be sorted. If there are no partitions, this checkbox will be unavailable.
The Calculations Tab
The Calculations Tab provides and interface for the two main inputs of the Calculated Table: a SQL query and information about when to update that query.
The Calculations tab has the following properties:
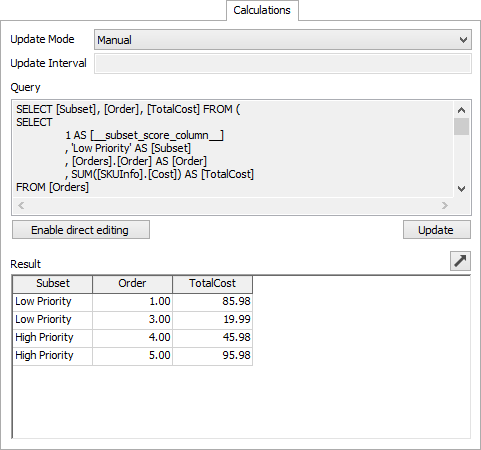
Update Mode
Change this option to choose how often the Calculated Table will update, which means running the query and dumping the results. There are three possible update modes:
- Manual - Use this option to only allow the Calculated Table to update by clicking the Update button.
- By Lazy Interval - Use this option to allow the Calculated Table to update on model reset and then at most once per interval (according to the Update Interval specified), and only if necessary.
- By Interval - Use this option to allow the Calculated Table to update on model reset and then in regular intervals according to the Update Interval specified
- Always - Use this option to allow the Calculated Table to update as often as neccessary so that the value always appears to be up to date.
Update Interval
Use this box to set the duration between updates for the By Interval and By Lazy Interval update modes.
Query
This box contains the query built by the query builder. If you enable direct editing, you can use this box to edit your own custom query.
Enable direct editing
Use this button if you want to remove the Query Builder interface from the Calculated Table. If you do so, you will be able to write your own query using the Query property. When writing your own query, you can reference any of your model's built-in tables, including Global Tables, Global Lists, Statistics Collectors, other Calculated Tables, and experiment data in this query. However, since the result is dumped into a bundle, each column in the SELECT statement should yield either a number, string, or node value. For more information on writing a valid SQL statement, see SQL Queries.
Update
Use this button to update the Calculated Table at any time, reguardless of the Update Mode. If the Update Mode is set to Manual, this is the only way the table can be updated. Clicking this button will cause the query to be rebuilt, and the table to be updated.
 Pop-out
Use this button to open a dockable view of the result table for this Calculated Table.
Result
This table shows the most recent result of the SQL query.
The Display Format Tab
The Display Format Tab specifies the display format for each column of the result table for the Calculated Table.
The Display Format tab has the following properties:
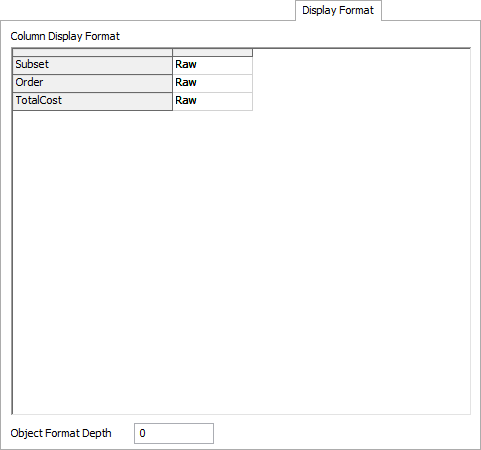
Column Display Format
Use this table to specify the format for each column in the result table. The list of columns is auto-generated based on the current result table.
Object Format Depth
This property affects columns that use the Object display format. In this display format, the full path to the object is shown. You can control how many nodes to display in the path with this value. If the value is 0, the full path will be used. If the value is 1, only the name of the node will be used. If it is 2, the path will include the name of the parent node as well as the current node.
The General Tab
The General tab has the following properties:
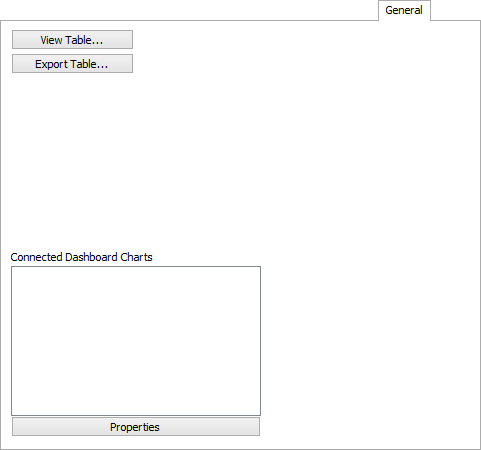
View Table...
Use this button to open a dockable view of the result table.
Export Table...
Use this button to export the table to a .CSV file.
Connected Dashboard Charts
Like the Statistics Collector, the Calculated Table shows a list of all Dashboard Charts that reference this table. The Properties button below this list opens the properties of the selected chart (if any).